Posts

Showing posts from October, 2014

Trend versus cycles in global temperature data

Image
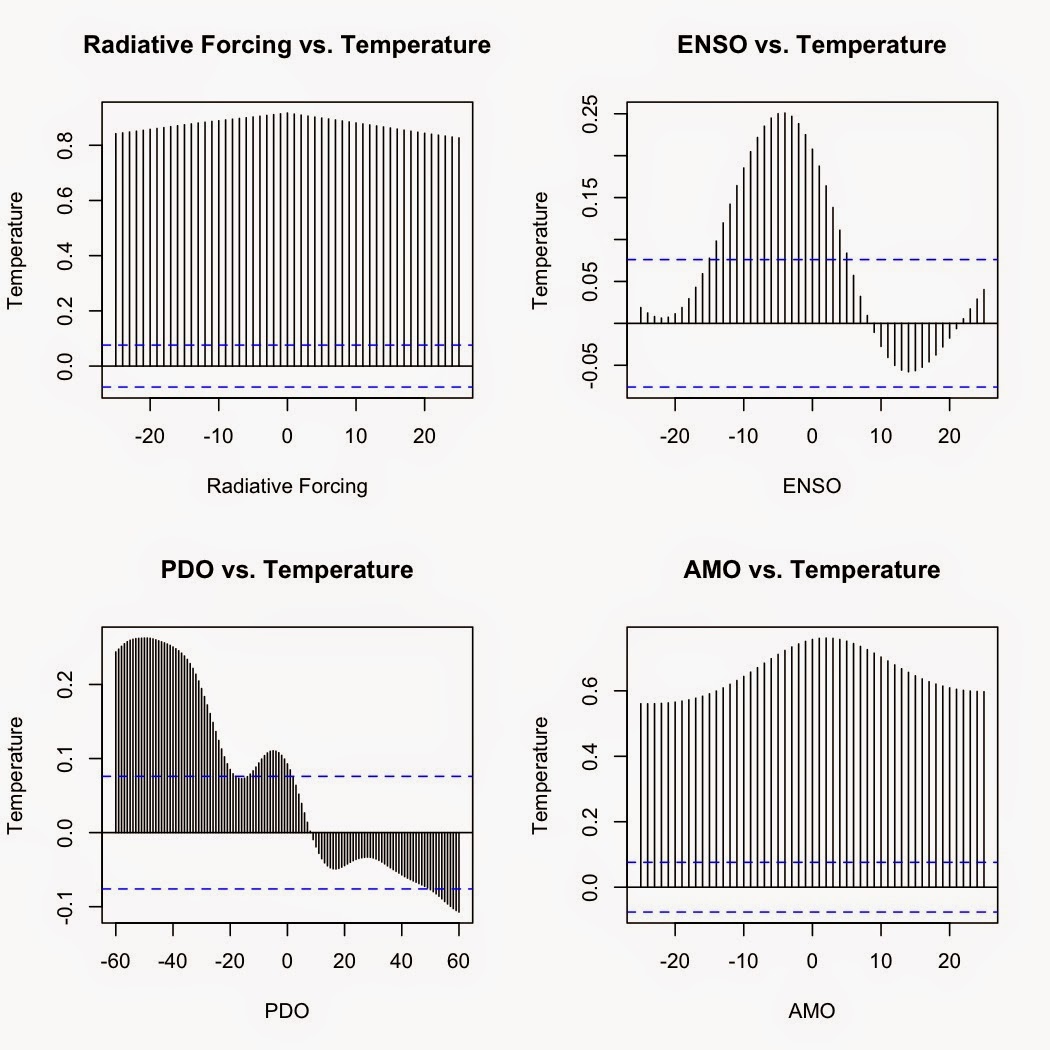
One of the most useful features about models, both statistical and physical, is that you can examine different aspects of the system you are analyzing separate from all other other influences.  Want to see if El NiƱo/Southern Oscillation could be driving the trend in global temperatures?  Construct a realistic model, then isolate the ENSO term.  Want to see if a combination of natural cycles explains the trend?  Isolate the terms for the natural cycles from those for greenhouse gases, and examine the results.

Global warming: Carbon dioxide vs. Natural cycles

Image
The recent paper by Johnstone and Mantua ( 2014 ) has certainly made the rounds in conservative circles.  It's popped up several times on my Facebook feed as various friends and acquaintances share articles about it.  Unfortunately, most of those articles get it wrong, usually twisting Johnstone and Mantua's findings to imply that 80% of ALL global warming is natural.  As I explained in my last post , that is a blatant misinterpretation of their paper, which only applies to the northeastern Pacific and coastal regions of the US Pacific Northwest.  Globally, natural cycles do not explain the trend in global temperatures.  How can I say that?  Do the statistics.

Temperature trends and natural variation in the Pacific Northwest

Image
A recent study by Johnstone and Mantua ( 2014 ) found a high correlation (r = 0.78) between sea surface temperatures since 1900 and changes in atmospheric pressure over the Northeastern Pacific, claiming that 80% of the variance in sea surface temperatures in the Northeastern Pacific was explained by changes in the North Pacific high.

Seeing how well predictions for September Arctic sea ice did in 2014

Image
In August, I published a post listing predictions of what the average September sea ice extent would be in 2014 .  Since September 2014 is now past, we can go back and see how those predictions panned out.  First, here are the predictions again: Month Model R 2 Ice extent in 2014 (millions of km 2 ) Predicted Sept. ice extent (millions of km 2 ) Graph June -13.5300 + 1.6913x 0.7522 11.09 5.23 July -4.80933 + 1.18618x 0.8796 8.17 4.88 August -1.69389 + 1.12965x 0.9674 6.13 5.23