Posts

Showing posts from August, 2013

Revisiting the question of "Has global warming stopped since 1998?"—again.

Image
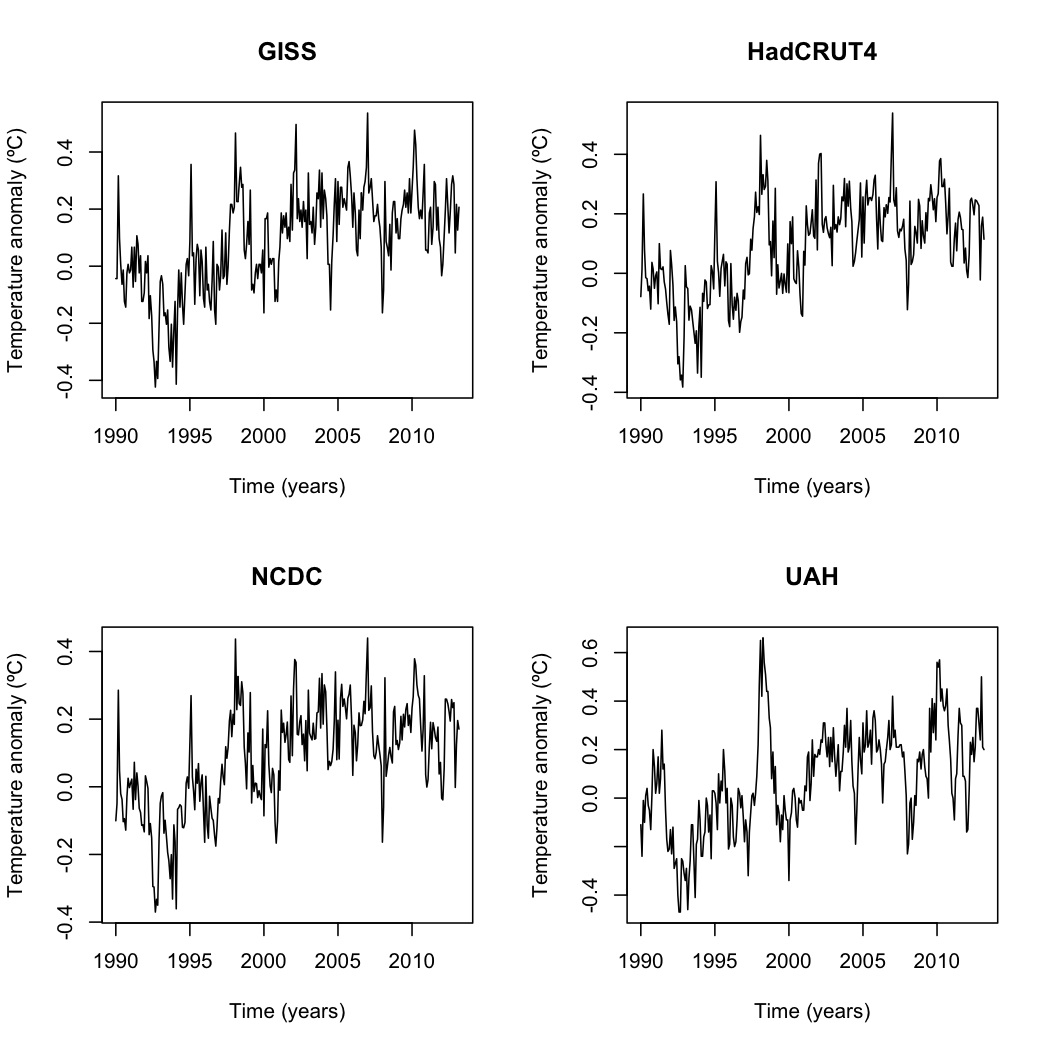
Let me be blunt: There is little evidence that global warming stopped in 1998 or any year thereafter.  Most of the evidence we have, from the energy imbalance to total heat content to ocean heat content, show that global warming continues, as I previously explained here , here , and here .  The only piece of evidence that appears to show that global warming has stopped is that the trend in surface temperature data is not statistically significant in recent years.  However, that is at best ambiguous.  No significant trend could mean that warming continues but short-term variation in the data masks the trend, that there's no warming or that there's a cooling trend but not enough data for that to be significant.  There's no real way to tell unless you either a) add enough data for short-term variation to cancel out or b) use statistical techniques to factor out the known natural variation. In this article, I expand on my previous analyses of surface temperature, this time us

Compensating for autocorrelation in global temperature data

Image
Autocorrelation in global temperature data simply means that the average temperature for any one month is correlated with the average temperature of the previous month.  It is an unfortunately common problem when dealing with time series and spatial statistics.  The gist of the issue is that most of the standard statistical analysis techniques such as ANOVA, regression, and the like assume that variation in the data is random or white noise when calculating standard errors and p-values.  Autocorrelation means that the noise in the data is not random but correlated or red noise.  The degree of correlation reduces the effective size of the data set and means that the standard errors and p-values calculated from normal statistical tests will be lower than they should be and biased toward showing statistical significance when in reality the tests should not show significance. One of the best ways to compensate for autocorrelation is to use an Autoregressive Integrated Moving Average (ARI

Anthropogenic climate change, evolution, and scientific theories

One of the common misconceptions about science is the nature of scientific theories.  Much of the confusion stems from the word "theory" having two very different definitions.  Among non-scientists, a theory is a guess, possibly an educated guess based on some facts, but a guess nonetheless.  It's little more than an opinion and less than a known fact (itself is usually taken to mean the unchanging truth) on the hierarchy of truth.  Skeptics often dismiss climate change and evolution with statements like "Human-caused global warming is just a theory, not a fact" or "Evolution is just a theory."  Those statements reveal that the person stating or writing them are using the non-scientific definition. In science, "fact" and "theory" have very different meanings from their nonscientific definitions.  "Facts" are data, discovered and verified via repeated observations and experiments to the point where it's ridiculous t

Time series decomposition in R

Image
Time series analysis is one of those scary sounding terms that in reality is very simple.  All it means is that you have data where the independent variable is time (seconds, minutes, hours, days, weeks, months, or years) and a dependent that changes over time.  Time series analysis is just methods for detecting trends in the dependent variable over time. The most basic time series analysis is linear regression, which I previously covered here .  In this post, I'll discuss time series decomposition.  Time series decomposition means that you break a time series into its constituent parts: Trend, seasonal, and random.  Seasonal means changes that occur in a regular cycle over the course of a year.  Random is random fluctuations within a time series that are neither part of the seasonal pattern nor the trend.  I'll demonstrate time series decomposition using Antarctic sea ice data . First, a graph of monthly average Antarctic sea ice since satellite records began in October

The logic is still the same...

even after six years.  This video from 2006 shows the logical absurdity of denying climate change.

A quick tutorial in R

Image
I've had a request for a quick tutorial on how to get started using R.  R is a statistical language that analyzes data and saves results in files called "objects."  You can then use the objects to create new analyses and objects.  Note: Wherever you see a "#", what follows is a comment.  You can delete that comment before running the code or leave it in—R ignores anything that follows a # sign.  Here's how I get my students started.

Yet another nail in the coffin for the "No warming since 1998" claim

Image
As I've already covered in the past ( here , here , and here ), the claim that the Earth hasn't warmed since 1998 is pure bunk.  Today, I re-ran a linear regression analysis and discovered that UAH satellite temperature data now shows statistically significant warming since 1998:

Invasive species: The impact of Emerald Ash Borer

Image
The impact of invasive species on native species is hitting close to home where I live right now.  Ash trees ( Fraxinus sp.) were popular shade trees in my area.  However, that is changing rapidly.  Wherever I drive, I see ash trees with dead tops and thick bunches of green leaves near the crotches of their main branches due to young sprouts.  Classic signs of Emerald Ash Borer ( Agrilus planipennis ) infestation.