Posts

Showing posts with the label prediction

Meltdown: An early prediction of September 2017 Actic sea ice extent

Image
Yes, I'm a bit late but the Arctic is in full meltdown this year. I crunched the numbers for April ice extent and found that this past April saw the second-lowest Arctic sea ice extent on record. Since 1979, average sea ice extent in April has declined by 1,403,600 square kilometers, an area nearly the size of Alaska and over twice the size of Texas. (Alaska has an area of 1,717,854 square kilometers and Texas comes in at 696,241 square kilometers. You can find a list of all 50 states at ThoughtCo.com in case you're curious). Even more worrisome is the record low average extent in the first four months of this year. Average monthly January to April extent has fallen by 1,626,860 square kilometers since 1979. This record low comes in spite of neutral ENSO conditions, indicating that something has changed in the Arctic and not for the better. Sea ice volume makes the point even more clear. So far, sea ice volume is setting new record lows, meaning there is a lot of th...

More predictions of September Arctic sea ice extent

Image
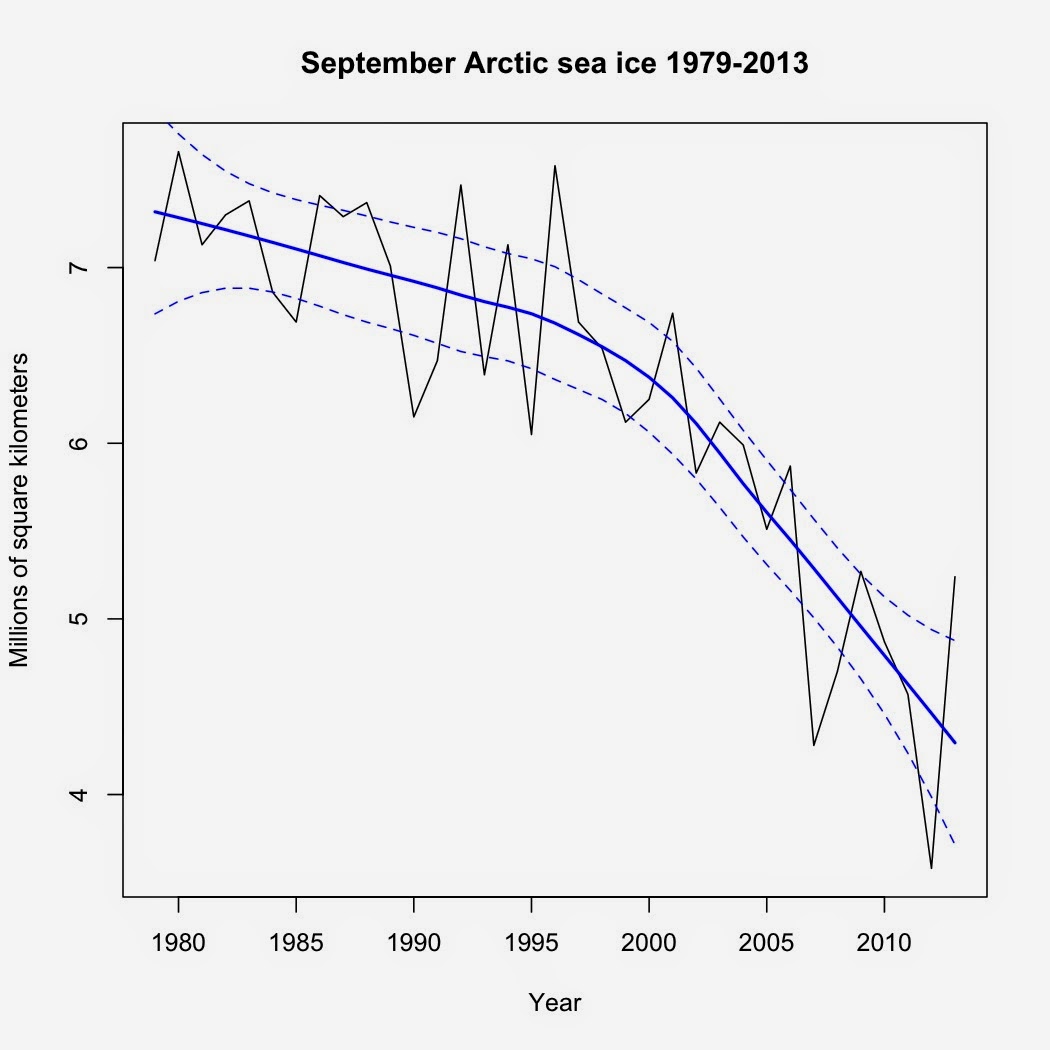
I published a prediction of Arctic sea ice extent on July 1 that was based on September sea ice extent from 1979 to 2013.  That model yielded a prediction that the average extent for September 2014 would be 4.135 million square kilometers.  However, that model does not take into consideration any other information we have on Arctic sea ice, such as the ice extent in previous months of the year.  It just gives the general trend of sea ice in September from year to year.  You cannot use it to predict ice extent based on current ice extent or conditions.

How low will it go?

Image
This is the time of year all eyes start turning toward the Arctic, specifically how rapidly and/or much the multiyear sea ice will melt this particular year.  Here is the average sea ice extent for September since 1979: I've added a loess regression line along with 95% confidence intervals to highlight the trend.  Despite last year's rebound from the 2012 low, the overall trend is decidedly down, with less multiyear ice remaining as time goes by. Now on to my prediction of what the ice will do this year.  What I did was simply to extrapolate based on the loess regression, which yielded a prediction of 4.135 million km 2 .  I also fitted a polynomial regression to the data, which produced a prediction of 4.085 million km 2 .  Both are well above the record low in 2012 (3.58 million km 2 ), showing how anomalous the 2012 low was.  If the loess curve holds, I wouldn't expect the trend to fall below the 2012 low until 2018. So, what is your prediction ...