Posts

Showing posts from July, 2013

No, global warming is not caused by urban heat island effects

Image
One of the most common objections to global warming is the claim that the warming trend is due to the urban heat island effect (UHI).  The urban heat island effect occurs because cities have more buildings, roads, and other paved surfaces than rural areas, absorb more sunlight and re-radiate it as infrared than trees, meadows, and fields.  Because of the extra infrared, cities are usually hotter than surrounding rural areas.  This effect is visible—just pull up a map of weather station temperatures around any medium to large city in the afternoon.  The city will be around 2 to 9ºC warmer than surrounding areas, depending on size.  This effect was first noticed by Luke Howard in the 1810s.  Recent research has shown that the urban heat island effect is due to a lack of vegetation, as transpiration is the key process that keeps the heat under control ( Zhang et al. 2012 ).  Some desert cities can actually be cooler than their surrounding areas due to ir...
Citizen science, ecology, and climate change

Science can seem distant from normal people, an activity done by a select few far removed from the real world.  However, there are several ways ordinary people can help us learn more about the world around us.

Arctic sea ice past and present

Image
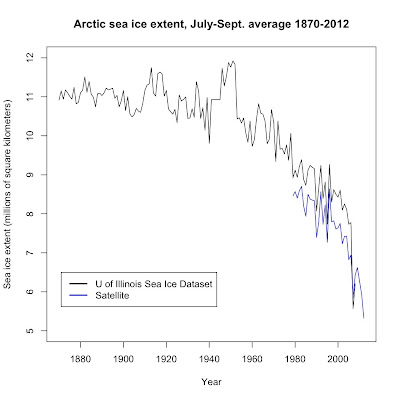
I've previously written about the recent changes in polar sea ice .  This post compares the current trends in Arctic ice with the previous century.  I've recently read several claims that the recent melting is matched by melting episodes in the 1920s and 1940s.  However, those claims are pure bunk.  Walsh and Chapman ( 2001 ) compiled records on Arctic sea ice extent since 1870 (updated data available here ).  I've graphed their July-September average, together with the July-September average measured by satellites since 1979:

Carbon Dioxide and Global Temperature: To lag or not to lag

Image
 One of the persistent puzzles about the ice ages is the appearance of an 600 to 800-year lag between Antarctic temperatures and atmospheric CO 2 levels.

Climate versus weather

Image
One of the main issues I encounter when I talk about global warming is people are confused about the distinction between climate and weather.  The two are related but fundamentally different phenomenon.

What are our options?

Image
One of the main conclusions from reading about global warming and associated climate change is that we humans must stop burning fossil fuels for energy in order to avoid the worst effects of global warming.  Unfortunately, that's easier said than done given that we've taken around 150 years to create the fossil fuel dependent economy we have now.  So, what do we need to do to transition to a fossil fuel-free future?

Meta-analysis

Image
A meta-analysis is a technique that combines data from multiple sources into one large dataset for statistical analysis.  This overcomes one of the main problems with many studies, which is sample size.  It's difficult and expensive in many fields to get a sufficiently large sample.  Doing a meta-analysis on data from multiple studies is a powerful way to get around that limitation.

Shifting bell curves

Image
One of the signatures of global warming is a shift in the frequency of global temperatures toward warmer temperatures.  One great way to visualize this shift in frequency is to plot out the densities of temperatures over several time periods.  For example, here is the density of global temperatures from 1880-1889, 1950-1959, and June 2003-May 2013:

The Nitrogen cycle—another natural cycle we've altered

Image
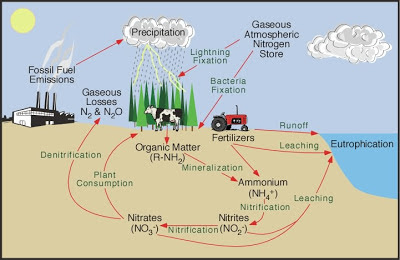
Nitrogen is an essential element for all life, as it's a major component of amino acids (proteins) and nucleic acids (DNA and RNA).  The main pool of nitrogen is the atmosphere, comprising 78% of the atmosphere as nitrogen gas (N 2 ).  Unfortunately, plants cannot use N 2 directly.  It must be converted to either ammonium (NH 3 ) or nitrate (NO 3 - ) before plants can absorb it and incorporate it into amino acids and nucleic acids.  In nature, most nitrogen conversion is done through a process known as nitrification wherein N 2 is converted first to NH 3 by several genera of nitrogen-fixing bacteria and cyanobacteria, then to NO 2 -  (nitrite) by bacteria in the genera Nitrosomonas or Nitrococcus , and finally to NO 3 - by bacteria in the Nitrobacter genus.  Nitrate that isn't absorbed by plants is returned to the atmosphere by the process of denitrification, wherein nitrate is converted to N 2 gas by denitrifying bacteria.

The Carbon Cycle

Image
This one is for those of you who were daydreaming through biology class at the end of the school year (you know who you are).  The carbon cycle is one of several ecological cycles we're currently messing up, along with the phosphorus cycle and nitrogen cycle (more on that one in a later post).  Just in case you've forgotten what the carbon cycle is, here's a diagram summarizing it:

Global temperature versus current carbon dioxide levels

Image
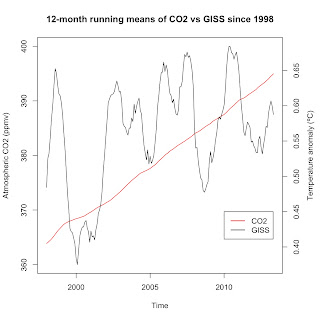
One of the persistent issues bedeviling public understanding of global warming is the apparent disconnect between CO 2 levels and global temperatures since 1998.  Skeptics claim that warming has slowed since 1998 while CO 2 has risen at an increasing rate.  At first glance, they might have a point—but only at first glance.  Here is the 12-month running average of Mauna Loa CO 2 measurements and GISS surface temperatures: