Global temperature versus current carbon dioxide levels
One of the persistent issues bedeviling public understanding of global warming is the apparent disconnect between CO2 levels and global temperatures since 1998. Skeptics claim that warming has slowed since 1998 while CO2 has risen at an increasing rate. At first glance, they might have a point—but only at first glance. Here is the 12-month running average of Mauna Loa CO2 measurements and GISS surface temperatures:
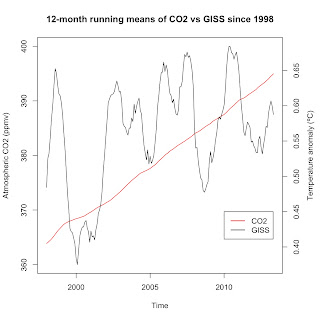
As you can see, CO2 has risen steadily since 1998, at an average rate of +1.985 ppmv per year (standard error = 0.03636 ppmv, p-value = < 2.2 x 10⁻¹⁶). GISS surface temperatures have also risen by an average of + 0.005967ºC per year (standard error = 0.002057ºC, p-value = 0.004183) but far less steadily and well below the 0.016ºC per year rate of the last 30 years. Shouldn't temperatures track CO2 levels?
There are several reasons you wouldn't expect surface temperatures over short time periods (and 15.33 years is short in terms of climate) to track CO2 very closely. First, the El Niño/La Niña cycle has large effects on surface temperatures on short time periods (see Foster and Rahmstorf 2011). El Niño, of course, is when ocean heat is dumped into the atmosphere, thereby raising surface temperatures. La Niña is when the ocean absorbs heat from the atmosphere, thereby lowering surface temperatures. We had mostly El Niño conditions over the first 7.5 years, with 1998 experiencing the most extreme El Niño in recorded history, and La Niña or neutral conditions dominating since 2010. That alone would flatten any warming trend by raising surface temperatures in the early part of the time period and lowering them in the later portion. Using Foster and Rahmstorf's method to accounting for El Niño/La Niña, changes in solar output, and aerosols removes much of the discrepancy:
The average rate of temperature rise after adjusting for El Niño/La Niña, solar output, and aerosols? +0.013602ºC per year (standard error = 0.001821ºC, p-value = 3.302 x 10⁻¹²), only a little below the 30 year rate.
Second, CO2 does not raise surface temperatures directly. Carbon dioxide and other greenhouse gases work by decreasing the amount of heat that leaves the atmosphere, thereby reducing the thermal gradient between the atmosphere and the surface and trapping more heat at the surface. That trapped energy then goes into the oceans, glaciers, polar ice caps, and land as well as the atmosphere. In fact, the atmosphere holds only 2.3% of the total heat trapped by the greenhouse effect. Over 90% of total heat is found in the oceans (i.e. Murphy et al. 2009, Church et al. 2011, Nuccitelli et al. 2012, Balmaseda et al. 2013), where it helps raise sea levels due to thermal expansion. Sea levels have been rising at an increasing rate since 1880 with just under half coming from thermal expansion (Church and White 2011, Church et al. 2011). While atmospheric temperatures have been measured longer, total heat content (atmosphere + oceans + ice + land) is actually the best measurement of global warming as it measures all of the heat from global warming, not just 2.3% of it. Since 1998, total heat accumulation has averaged +8.145 x 10²¹ J per year (standard error = 2.693 x 10²⁰ J, p-value = 1.957 x 10⁻¹³).
Third, changes in CO2 levels will not (and indeed cannot) change surface temperatures instantaneously. There's always going to be a lag between increases in CO2 and surface temperatures. The Earth's energy imbalance is the physical manifestation of that lag. Global warming won't stop until the atmosphere warms up enough to radiate as much infrared energy out as there is solar energy hitting the ground and the imbalance is zero. With the imbalance currently running around 0.75 J/s/m2, we have another 0.61ºC of surface warming in store at current CO2 levels. If we were to put it into an equation, it would be
Total warming due to CO2 = Current surface temperature + Future warming (via energy imbalance)
According to GISS, we've already warmed by an average of 0.79ºC since the 1880s (calculated by taking the difference between the 1880-1890 average and the 2003-2013 average). At the current energy imbalance, we're looking at a total of 1.40ºC of surface warming due to current greenhouse gas and aerosol levels, very close to the 1.48ºC of total surface warming we'd predict for CO2 alone using the equilibrium climate sensitivity equation (ΔT = λΔF) and the Myhre et al. (1998) equation for ΔF due to CO2 (ΔF = 5.35 W/m2 * ln(C/C0)).
In short, when you actually examine the issue, there really is no disconnect between CO2 and global surface temperatures. Global surface temperatures are very close to what you'd expect at the current level of CO2. The reasons for the apparent disconnect since 1998 are two-fold. First, starting a trend at the strongest El Niño on record guarantees a lower estimate of surface warming (as examined here). Second, more La Niñas over the past 7.5 years means more heat going into the oceans rather than the atmosphere. The main issue is how to communicate this to the general public, as the explanation won't fit on a bumper sticker.

There are several reasons you wouldn't expect surface temperatures over short time periods (and 15.33 years is short in terms of climate) to track CO2 very closely. First, the El Niño/La Niña cycle has large effects on surface temperatures on short time periods (see Foster and Rahmstorf 2011). El Niño, of course, is when ocean heat is dumped into the atmosphere, thereby raising surface temperatures. La Niña is when the ocean absorbs heat from the atmosphere, thereby lowering surface temperatures. We had mostly El Niño conditions over the first 7.5 years, with 1998 experiencing the most extreme El Niño in recorded history, and La Niña or neutral conditions dominating since 2010. That alone would flatten any warming trend by raising surface temperatures in the early part of the time period and lowering them in the later portion. Using Foster and Rahmstorf's method to accounting for El Niño/La Niña, changes in solar output, and aerosols removes much of the discrepancy:
 |
| R code for adjusting temperature data from Foster and Rahmstorf (2011) available online here |
Second, CO2 does not raise surface temperatures directly. Carbon dioxide and other greenhouse gases work by decreasing the amount of heat that leaves the atmosphere, thereby reducing the thermal gradient between the atmosphere and the surface and trapping more heat at the surface. That trapped energy then goes into the oceans, glaciers, polar ice caps, and land as well as the atmosphere. In fact, the atmosphere holds only 2.3% of the total heat trapped by the greenhouse effect. Over 90% of total heat is found in the oceans (i.e. Murphy et al. 2009, Church et al. 2011, Nuccitelli et al. 2012, Balmaseda et al. 2013), where it helps raise sea levels due to thermal expansion. Sea levels have been rising at an increasing rate since 1880 with just under half coming from thermal expansion (Church and White 2011, Church et al. 2011). While atmospheric temperatures have been measured longer, total heat content (atmosphere + oceans + ice + land) is actually the best measurement of global warming as it measures all of the heat from global warming, not just 2.3% of it. Since 1998, total heat accumulation has averaged +8.145 x 10²¹ J per year (standard error = 2.693 x 10²⁰ J, p-value = 1.957 x 10⁻¹³).
 |
| Data from Nuccitelli et al. 2012. Available here |
Total warming due to CO2 = Current surface temperature + Future warming (via energy imbalance)
According to GISS, we've already warmed by an average of 0.79ºC since the 1880s (calculated by taking the difference between the 1880-1890 average and the 2003-2013 average). At the current energy imbalance, we're looking at a total of 1.40ºC of surface warming due to current greenhouse gas and aerosol levels, very close to the 1.48ºC of total surface warming we'd predict for CO2 alone using the equilibrium climate sensitivity equation (ΔT = λΔF) and the Myhre et al. (1998) equation for ΔF due to CO2 (ΔF = 5.35 W/m2 * ln(C/C0)).
In short, when you actually examine the issue, there really is no disconnect between CO2 and global surface temperatures. Global surface temperatures are very close to what you'd expect at the current level of CO2. The reasons for the apparent disconnect since 1998 are two-fold. First, starting a trend at the strongest El Niño on record guarantees a lower estimate of surface warming (as examined here). Second, more La Niñas over the past 7.5 years means more heat going into the oceans rather than the atmosphere. The main issue is how to communicate this to the general public, as the explanation won't fit on a bumper sticker.


Good job, Jim!
ReplyDeleteMeanwhile, journal papers often minimize the impact of tropospheric aerosolized sulfate loading on sunlight obscuration, i.e., "global dimming", preferring to focus on ENSO, deep ocean heat sequester, and a very modest decrease in solar output.
Yet, the consensus cause for the post-WWII to 1980 warming pause is aerosolized sulfates from (mainly U.S.) unscrubbed, coal-fired power plants, prior to the multiple 1980's Clean Air Acts.
This factor is something that Jim Hansen started saying more than a decade ago, yet another reason I trust Hansen more than the conservative amalgam spearheaded by the IPCC reports.
I also suspect that increased Chinese/Indian aerosols aren't even as well-inventoried as their CO2 emissions; that it's rather naive to rely on official government stats for such values.
And ground truthing is tough, as the pyranometer network measuring incoming solar rad is entirely subject to local cloud cover, even terrain effects. Whereas, at sea, beyond the coastal/tropical Pacific NOAA/NBDC buoy network
http://www.ndbc.noaa.gov/obs.shtml
(a total of 5 buoys for the whole Indian Ocean), data is damn sparse, as well as unreliable.
E.g., on-ship, it's pitch and roll baby, pitch and roll.
I'll try to find more recent data, but the obs reported in wikipedia suggesting some reversal of global dimming (global brightening) are 8 to 10 years old,
http://en.wikipedia.org/wiki/Global_dimming#cite_note-Wild_et_al._2007-33
too old to pick up more recent, Asia-driven sulfate emissions.
That's an excellent point. One question to consider: Wouldn't the increase in sulfate aerosols be reflected in aerosol optical depth measurements?
Delete