Revisiting the question of "Has global warming stopped since 1998?"—again.
Let me be blunt: There is little evidence that global warming stopped in 1998 or any year thereafter. Most of the evidence we have, from the energy imbalance to total heat content to ocean heat content, show that global warming continues, as I previously explained here, here, and here. The only piece of evidence that appears to show that global warming has stopped is that the trend in surface temperature data is not statistically significant in recent years. However, that is at best ambiguous. No significant trend could mean that warming continues but short-term variation in the data masks the trend, that there's no warming or that there's a cooling trend but not enough data for that to be significant. There's no real way to tell unless you either a) add enough data for short-term variation to cancel out or b) use statistical techniques to factor out the known natural variation.
In this article, I expand on my previous analyses of surface temperature, this time using GISS, NCDC, HadCRUT4, and UAH. Previously, I had focused on only GISS or UAH. I first adjusted all temperature anomalies to the 1981-2010 baseline and used the technique of Foster and Rahmstorf (2011) to factor out short-term variation due to ENSO, solar cycles, and aerosols between January 1979 and March 2013. For each start year between 1990 and 2000, I estimated the amount of autocorrelation in the temperature data before and after adjusting for short-term variation using auto.arima in the nlme package for R and then the autocorrelation-corrected trend using generalized least squares from the forecast package. I plotted the trends ± 95% confidence intervals for raw and adjusted data to compare how the trends change depending on start year.
First, here's the raw data since 1990:
Not much to say that hasn't already been written. All the data show an increase since the 1990s, with an apparent flattening of the trend since 1998 and, in the three surface datasets, a slight cooling since 2005. After factoring out for ENSO, the solar cycle, and changes in aerosols, the four datasets look like this:
While variation remains, the overall trend in each data set is much easier to see after short-term variation is factored out. Now the apparent flattening doesn't begin until after 2010. Of course, saying that temperatures have been flat for the past 3 years doesn't have quite the power of saying that they've been flat since 1998. Plotting regression trends starting between 1990 and 2000 reveals that the trend in the adjusted data is higher than the trend in the unadjusted data and that the trend in the adjusted data is more stable than the trend in the unadjusted data.

The trend in adjusted GISS data decreases only slightly, although the change is not statistically significant, as shown by the overlap between the 95% confidence intervals. The decline in the trend in unadjusted data is much larger. However, that change is also not statistically significant as the 95% confidence intervals also overlap. While the trend since 1997 is not significantly different from zero in the unadjusted data, the trend in the adjusted data remains statistically significant throughout. The same pattern appears in the other three sets of data.
NCDC:

HadCRUT4:

UAH:

While the the unadjusted data generally shows a decline in the rate of warming depending on the start point, the decline is not statistically significant due to large standard errors and confidence intervals. The trend in the adjusted data generally declines as well in the surface data but interestingly not in UAH satellite data. With less variation in the adjusted data, the standard errors of the adjusted trends are far smaller and the trends are significant regardless of start point. The differences between the trends in adjusted versus unadjusted data clearly show the influence of short-term variation, as represented by ENSO, aerosols, and the solar cycle, in determining the trend in unadjusted temperature data, especially as the time period gets shorter.
There has been numerous claims that IPCC climate models are wrong as they don't match surface temperature data since 1998 (i.e. Fyfe et al. 2013). While true, the reason the models don't match is not because CO2 doesn't affect global temperature or that anthropogenic climate change theory is wrong as many deniers are claiming. For either of those to be wrong, much of our understanding of atmospheric physics would have to be wrong as well, to say nothing of 152 years worth of experimental results. The reason most climate models don't match is that generally they account for the long-term influence of CO2 but do not accurately predict short-term variability (i.e. Rahmstorf et al. 2012). Few climate models can accurately predict the timing of past ENSO events much less predict the timing of future events; none predict changes in aerosols or solar output. Short-term variation also cancels out in longer model runs or when averaging multiple models together. In addition, the models overestimate the amount of change in greenhouse gas emissions and the resultant change in climate forcing (see Spencer Weart's interview with James Hansen in 2000). It's therefore not surprising that the IPCC models do not match surface temperatures since 1998. Once climate models are corrected for actual short-term variability and climate forcings, they replicate the slow-down in warming since 1998 quite well and show that ENSO is responsible for most of the slow-down (i.e. Kosaka and Xie 2013).
Two comments on Fyfe et al. (2013). First, starting a temperature trend at a known outlier is bogus, as it artificially lowers the trend. You can clearly see in the trend plots above that trend starting at 1998 are far lower than trends starting at any other year. Starting at 1998 guarantees that the difference between observed and predicted trend will appear larger than starting at any other year. Second, the data set they used, HadCRUT4, is known to show less warming than other data sets since AD 2000 because HadCRUT4 has poor geographic coverage of the polar regions, which just happen to be the fastest warming regions of the planet. In short, Fyfe et al.'s choice of temperature data set and start point effectively biased their analysis toward finding that model trends were higher than observed trends, whether true or not. For that reason, I'm surprised that Fyfe et al. (2013) got published. Their analysis would have been much stronger if they had included other data sets (i.e. UAH, GISS, NCDC) and other start points.
What can be concluded about the slow-down in surface warming since 1998? First, that much of the slow-down is due to short-term variation in the climate system. A predominant cooling phase of ENSO, an increase in aerosols, and a deep solar minimum have combined to mask the long-term warming trend. Second, that the warming trend continues unabated as shown once ENSO and other known variation are factored out. This means that once the short-term variation swings back toward warming phases, we'll see faster warming that we otherwise would expect. This isn't surprising, as physical data such as the total heat content of the Earth continues to rise and the energy imbalance continues as I've written before. Third, just because the IPCC models are wrong does not mean the entire science is wrong. The models don't incorporate all that we know about climate and therefore are imperfect reflections of the science. Lastly, beware those who proclaim that global warming has stopped since 1998 based on the linear trend. If those people were telling the full story, they'd have to admit that the rate of warming since 1998 is statistically indistinguishable from the rates of earlier years, as shown by the overlapping 95% confidence intervals.
In this article, I expand on my previous analyses of surface temperature, this time using GISS, NCDC, HadCRUT4, and UAH. Previously, I had focused on only GISS or UAH. I first adjusted all temperature anomalies to the 1981-2010 baseline and used the technique of Foster and Rahmstorf (2011) to factor out short-term variation due to ENSO, solar cycles, and aerosols between January 1979 and March 2013. For each start year between 1990 and 2000, I estimated the amount of autocorrelation in the temperature data before and after adjusting for short-term variation using auto.arima in the nlme package for R and then the autocorrelation-corrected trend using generalized least squares from the forecast package. I plotted the trends ± 95% confidence intervals for raw and adjusted data to compare how the trends change depending on start year.
First, here's the raw data since 1990:
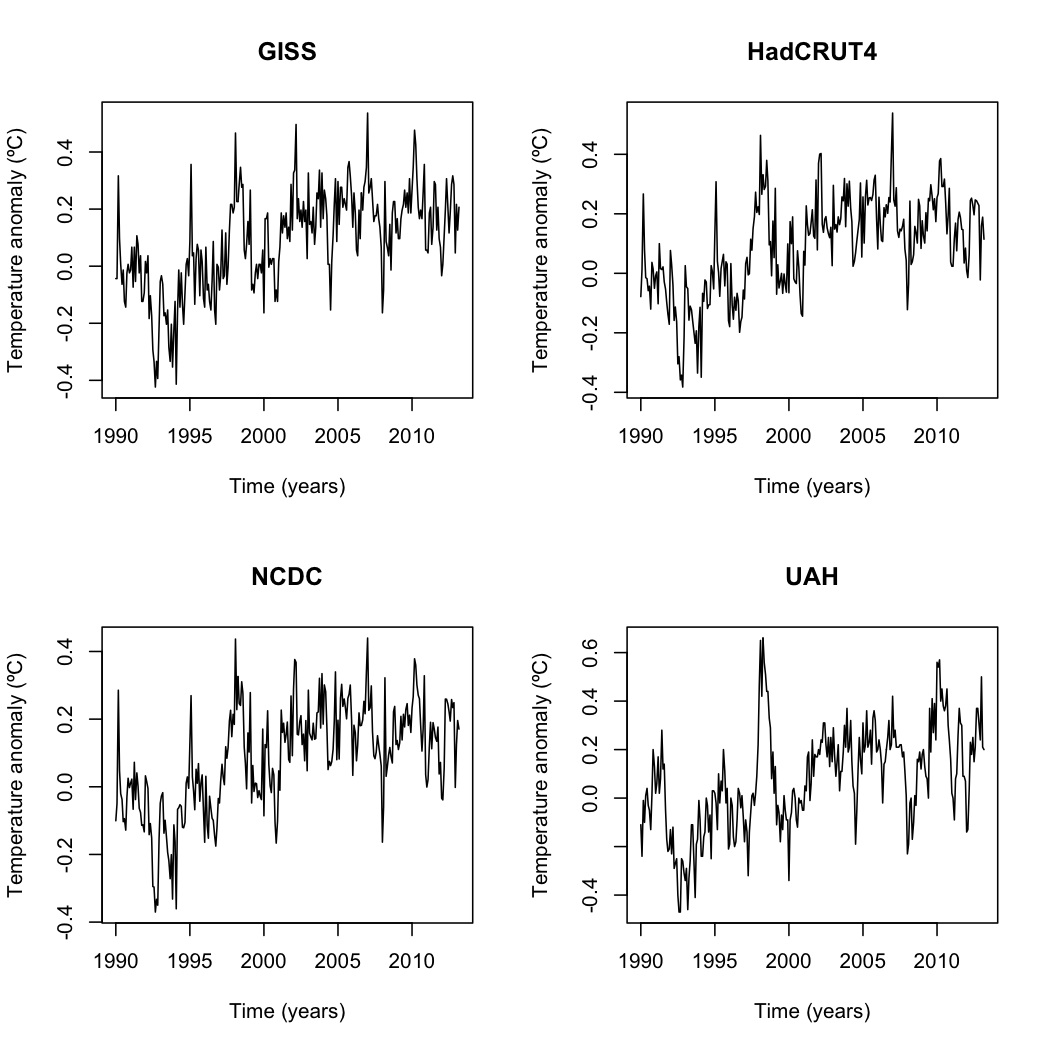 |
| Global temperature data before adjustments for ENSO, aerosols, and the solar cycle |
Not much to say that hasn't already been written. All the data show an increase since the 1990s, with an apparent flattening of the trend since 1998 and, in the three surface datasets, a slight cooling since 2005. After factoring out for ENSO, the solar cycle, and changes in aerosols, the four datasets look like this:
 |
| Global temperature data after adjusting for ENSO, aerosols, and the solar cycle. |
The trend in adjusted GISS data decreases only slightly, although the change is not statistically significant, as shown by the overlap between the 95% confidence intervals. The decline in the trend in unadjusted data is much larger. However, that change is also not statistically significant as the 95% confidence intervals also overlap. While the trend since 1997 is not significantly different from zero in the unadjusted data, the trend in the adjusted data remains statistically significant throughout. The same pattern appears in the other three sets of data.
NCDC:
HadCRUT4:
UAH:
While the the unadjusted data generally shows a decline in the rate of warming depending on the start point, the decline is not statistically significant due to large standard errors and confidence intervals. The trend in the adjusted data generally declines as well in the surface data but interestingly not in UAH satellite data. With less variation in the adjusted data, the standard errors of the adjusted trends are far smaller and the trends are significant regardless of start point. The differences between the trends in adjusted versus unadjusted data clearly show the influence of short-term variation, as represented by ENSO, aerosols, and the solar cycle, in determining the trend in unadjusted temperature data, especially as the time period gets shorter.
There has been numerous claims that IPCC climate models are wrong as they don't match surface temperature data since 1998 (i.e. Fyfe et al. 2013). While true, the reason the models don't match is not because CO2 doesn't affect global temperature or that anthropogenic climate change theory is wrong as many deniers are claiming. For either of those to be wrong, much of our understanding of atmospheric physics would have to be wrong as well, to say nothing of 152 years worth of experimental results. The reason most climate models don't match is that generally they account for the long-term influence of CO2 but do not accurately predict short-term variability (i.e. Rahmstorf et al. 2012). Few climate models can accurately predict the timing of past ENSO events much less predict the timing of future events; none predict changes in aerosols or solar output. Short-term variation also cancels out in longer model runs or when averaging multiple models together. In addition, the models overestimate the amount of change in greenhouse gas emissions and the resultant change in climate forcing (see Spencer Weart's interview with James Hansen in 2000). It's therefore not surprising that the IPCC models do not match surface temperatures since 1998. Once climate models are corrected for actual short-term variability and climate forcings, they replicate the slow-down in warming since 1998 quite well and show that ENSO is responsible for most of the slow-down (i.e. Kosaka and Xie 2013).
Two comments on Fyfe et al. (2013). First, starting a temperature trend at a known outlier is bogus, as it artificially lowers the trend. You can clearly see in the trend plots above that trend starting at 1998 are far lower than trends starting at any other year. Starting at 1998 guarantees that the difference between observed and predicted trend will appear larger than starting at any other year. Second, the data set they used, HadCRUT4, is known to show less warming than other data sets since AD 2000 because HadCRUT4 has poor geographic coverage of the polar regions, which just happen to be the fastest warming regions of the planet. In short, Fyfe et al.'s choice of temperature data set and start point effectively biased their analysis toward finding that model trends were higher than observed trends, whether true or not. For that reason, I'm surprised that Fyfe et al. (2013) got published. Their analysis would have been much stronger if they had included other data sets (i.e. UAH, GISS, NCDC) and other start points.
What can be concluded about the slow-down in surface warming since 1998? First, that much of the slow-down is due to short-term variation in the climate system. A predominant cooling phase of ENSO, an increase in aerosols, and a deep solar minimum have combined to mask the long-term warming trend. Second, that the warming trend continues unabated as shown once ENSO and other known variation are factored out. This means that once the short-term variation swings back toward warming phases, we'll see faster warming that we otherwise would expect. This isn't surprising, as physical data such as the total heat content of the Earth continues to rise and the energy imbalance continues as I've written before. Third, just because the IPCC models are wrong does not mean the entire science is wrong. The models don't incorporate all that we know about climate and therefore are imperfect reflections of the science. Lastly, beware those who proclaim that global warming has stopped since 1998 based on the linear trend. If those people were telling the full story, they'd have to admit that the rate of warming since 1998 is statistically indistinguishable from the rates of earlier years, as shown by the overlapping 95% confidence intervals.


One nit. Increased aerosol sulfate loading from unscrubbed coal-fired power plants isn't natural variation and I don't think it's factored into the CMIP models either, at least quantitatively correctly, given we don't even know how much loading there's been since this century began.
ReplyDeleteSeveral small natural forcings also may be adding to aerosol loading. I.e., slightly decreased solar transmittance due to increased atmospheric water vapor with temperature rise, increased mid-scale volcanic activity, and of course a deeper and more prolonged than usual solar minimum. If you add several such 5 - 10% negative forcings to a 40% negative from increased aerosol loading, plus the predominance of La Ninas over El Ninos this century, in sum they may have negated the CO2 forcing entirely.
2011: Full Text, R. K Kaufmann, et al., Reconciling anthropogenic climate change with observed temperature 1998–2008, PNAS, 108, 29, 11790-11793
http://www.pnas.org/content/108/29/11790.full
Thanks for the correction. I'll reword the parts about natural variation to account for those points.
Delete