The last time the Earth had a 15-year cooling trend of any kind...
I was asked by a friend to identify the last time the Earth experienced a 15-year cooling trend. The way I answered this was to use a rolling regression on GISS surface data (R code at the bottom). Turns out that the last time was before I was born. The period from February 1958-January 1973 (cooling of -0.00188ºC per decade) was the last 15-year cooling trend in GISS surface data. Every 15-year period since has shown a warming trend of some magnitude—and yes, that even includes trends starting in 1998.
Now as to the last time the Earth showed a statistically significant 15-year cooling trend, well, that's a bit tougher to answer. The code I'm using cannot account for autocorrelation, which means that it is biased toward showing significant time series trends when in reality the trends are not significant. The original code also didn't compensate for multiple comparisons. Even using that extremely lenient standard of significance, however, the last time the Earth experienced a statistically significant cooling trend was from August 1957 to July 1972 (trend: -0.00424ºC per year, p-value = 0.0425). So at the very least, it's been 41 years since the Earth last had a 15-year cooling trend of any sort—and 41.5 years since the Earth had a statistically significant 15-year cooling trend.
Update
I realized that I made a mistake in not compensating for multiple comparisons. Since I was computing every possible 15-year trend, 5% of the trends would be statistically significant by chance alone. With 1,416 computed trends, that means around 71 of them would be statistically significant by chance. To compensate for multiple comparisons, I used the p.adjust function in R to use the Benjamini & Yekutieli (2001) method for compensating for fake positives. When I did that, the last statistically significant cooling trend was pushed back in time to the 15 years between February 1943 and January 1958 (trend: -0.06929ºC per decade, p = 0.04). Again, this is without autocorrelation, so it's very likely that even that cooling was not actually statistically significant. But it's been at least 56 years since the last statistically significant 15-year cooling trend. And my guess is that if I could incorporate autocorrelation in to my code, it would be far longer than that. The current warming really started in 1910, so the safe bet would be 1910 or before.
If any of my readers know how to incorporate ARMA into a rolling regression in R, please leave a comment with the code and I'll update my analysis.
Thanks.
Updated R code used for this analysis
Climate=read.csv("monthly.csv", header=T)
install.packages("zoo")
library(zoo)
Climate.1880=subset(Climate, Year>=1880)
GISS=ts(Climate.1880$GISS, start=c(1880,1), frequency=12)
GISS=as.zoo(GISS)
GISS=merge(GISS=GISS, time=time(GISS))
func=function(z) {
co=coef(summary(lm(GISS~time, data=as.data.frame(z))))
c(Est=co[,1], SE=co[,2], t=co[,3], p=co[,4])
}
rr=rollapply(GISS, width=180, FUN=func, by.column=FALSE, align="right")
rr$p.time.adj=p.adjust(rr$p.time, method="BY", n=length(rr$p.time))
rr
plot(rr[,2], type="l", xlab="Years", ylab="15-year trend (ºC/year)", main="15-year trends in GISS surface temperature data")
curve(0+x*0, add=T)
text(1950, 0.03, "Warming Trend", col="Red", lwd=2)
text(1950, -0.02, "Cooling Trend", col="Blue", lwd=2)
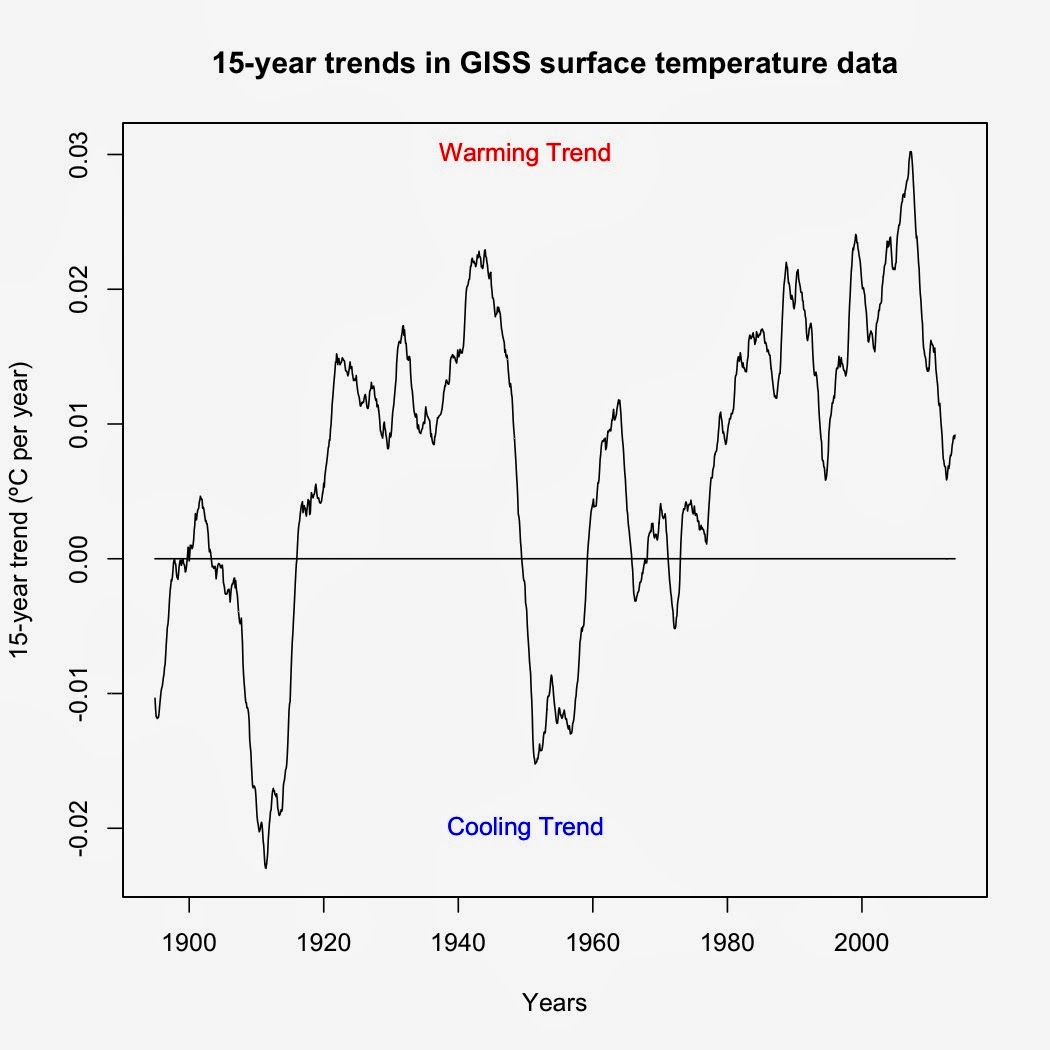 |
| Figure 1. Graph of temperature trends over each 15-year period. Each point represents the trend over the preceding 15-year period. |
Now as to the last time the Earth showed a statistically significant 15-year cooling trend, well, that's a bit tougher to answer. The code I'm using cannot account for autocorrelation, which means that it is biased toward showing significant time series trends when in reality the trends are not significant. The original code also didn't compensate for multiple comparisons. Even using that extremely lenient standard of significance, however, the last time the Earth experienced a statistically significant cooling trend was from August 1957 to July 1972 (trend: -0.00424ºC per year, p-value = 0.0425). So at the very least, it's been 41 years since the Earth last had a 15-year cooling trend of any sort—and 41.5 years since the Earth had a statistically significant 15-year cooling trend.
Update
I realized that I made a mistake in not compensating for multiple comparisons. Since I was computing every possible 15-year trend, 5% of the trends would be statistically significant by chance alone. With 1,416 computed trends, that means around 71 of them would be statistically significant by chance. To compensate for multiple comparisons, I used the p.adjust function in R to use the Benjamini & Yekutieli (2001) method for compensating for fake positives. When I did that, the last statistically significant cooling trend was pushed back in time to the 15 years between February 1943 and January 1958 (trend: -0.06929ºC per decade, p = 0.04). Again, this is without autocorrelation, so it's very likely that even that cooling was not actually statistically significant. But it's been at least 56 years since the last statistically significant 15-year cooling trend. And my guess is that if I could incorporate autocorrelation in to my code, it would be far longer than that. The current warming really started in 1910, so the safe bet would be 1910 or before.
If any of my readers know how to incorporate ARMA into a rolling regression in R, please leave a comment with the code and I'll update my analysis.
Thanks.
Updated R code used for this analysis
Climate=read.csv("monthly.csv", header=T)
install.packages("zoo")
library(zoo)
Climate.1880=subset(Climate, Year>=1880)
GISS=ts(Climate.1880$GISS, start=c(1880,1), frequency=12)
GISS=as.zoo(GISS)
GISS=merge(GISS=GISS, time=time(GISS))
func=function(z) {
co=coef(summary(lm(GISS~time, data=as.data.frame(z))))
c(Est=co[,1], SE=co[,2], t=co[,3], p=co[,4])
}
rr=rollapply(GISS, width=180, FUN=func, by.column=FALSE, align="right")
rr$p.time.adj=p.adjust(rr$p.time, method="BY", n=length(rr$p.time))
rr
plot(rr[,2], type="l", xlab="Years", ylab="15-year trend (ºC/year)", main="15-year trends in GISS surface temperature data")
curve(0+x*0, add=T)
text(1950, 0.03, "Warming Trend", col="Red", lwd=2)
text(1950, -0.02, "Cooling Trend", col="Blue", lwd=2)


I know that Skepical Science's "Temperature trend calculator" uses an ARMA, but I don't know how it is implemented. It may be a good palce to look at, though.
ReplyDeletehttp://www.skepticalscience.com/trend.php
Thanks for your comment. I know of that calculator and can already do similar manual analyses in R. However, doing what I did above manually would be very labor intensive, with 1,416 separate calculations required to cover the entire time period. Hence my desire to figure out some way of incorporating ARMA into my rolling regression code to do those calculations automatically.
DeleteI'm afraid I do not understand this graph. The vertical axis is "15 year trend" . I take that to mean that any point on the graph shows a 15 year trend (warming or cooling).. To me, that means, if I look at year 1900, where it appears to be at its lowest, it corresponds to approximately a negative 0.025 trend, which means that for the 15 year period prior to 1900, there was a cooling trend.
ReplyDeleteAnd when I look at the period of 1958 to 1973, I see cooling, changing to warming (around 1960) followed by warming until about 1970 when it becomes cooling again.
Can you straighten me out?
There's not much to straighten out, as you have correctly interpreted my graph. Each point shows the trend over the previous 15 years, as you stated. I've added a caption that should help clear up any confusion.
Delete