A prediction of global surface temperatures if an El Niño forms this year.
There are increasing evidence that we'll have our first El Niño since 2010 sometime within the next year. Just for fun, I thought it would be interesting to try to predict what the annual global average temperature would be if an El Niño developed as expected.
I took Berkeley Earth land + ocean annual temperature data starting in 1970 and categorized each year as El Niño, La Niña, or neutral using average MEI data for each year. Any year with an MEI average ≥ +0.5 was classed as an El Niño year. La Niña years had MEI values ≤ -0.5, whereas neutral years were between -0.5 and +0.5. I then performed a separate linear regression on each category.
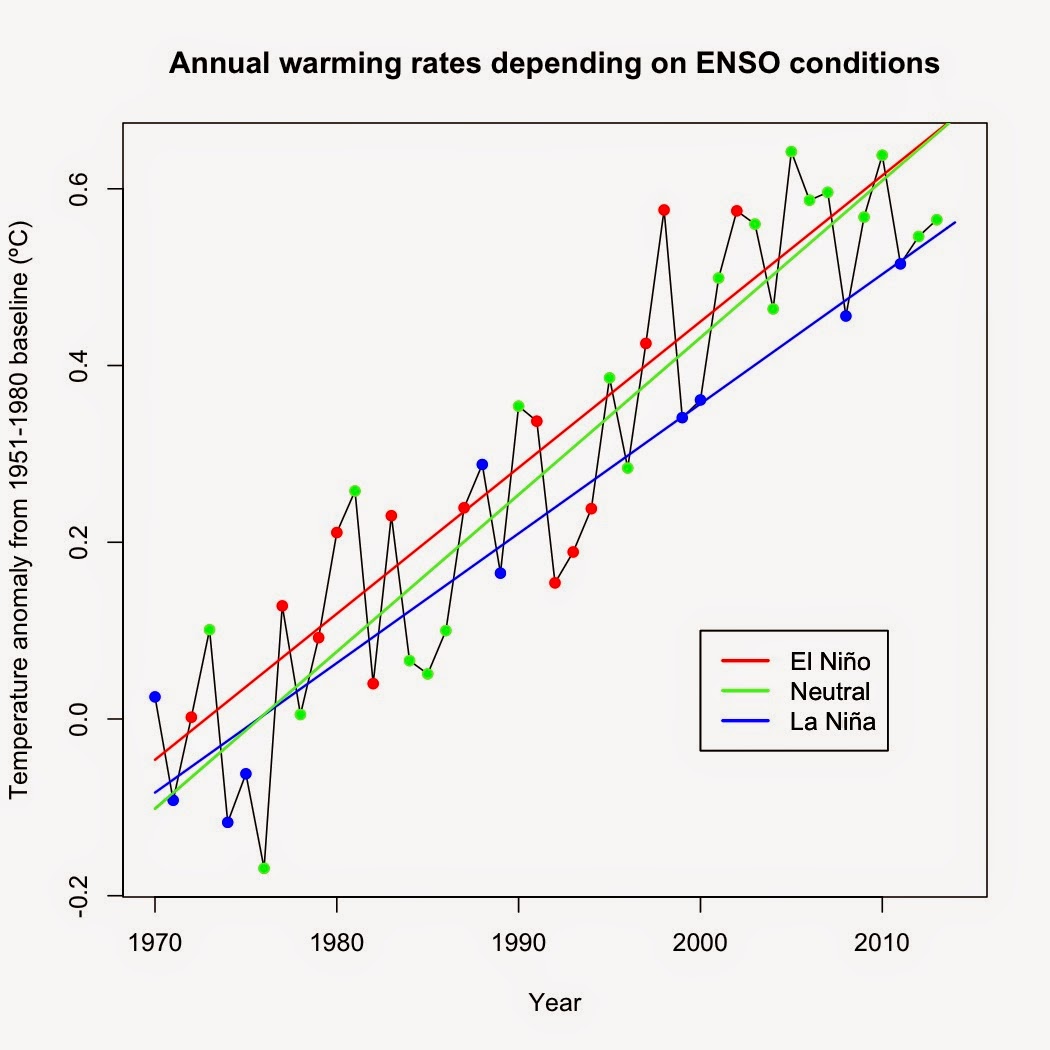
This criterion isn't perfect—it misses the weaker El Niño/Southern Oscillation (ENSO) events. The El Niño of 2009–2010, for instance, doesn't register as an El Niño at all, with a classification of neutral for both 2009 and 2010. This means that my regression analysis of both El Niño and La Niña will be based primarily on only the strongest events whereas the neutral category will capture the weaker El Niño and La Niña events as well as truly neutral years. Given the propensity for weak El Niños in the last decade, this means that the regression for the neutral category overestimates the actual rate of warming during ENSO neutral years due to the influential point effect.
Note that surface temperatures rose regardless of ENSO conditions. If surface warming was primarily due to ENSO as some deniers have argued, then we'd expect surface warming to occur primarily during El Niños and little to no change in temperatures over time during La Niñas. The fact that surface temperatures rose during both El Niños and La Niñas refutes that argument. It's also interesting to note that the rate of surface warming during neutral ENSO conditions is faster than either the overall rate or the rate during El Niño events. I personally would have expected that El Niño events would have shown the fastest rate of surface warming.
Using the regression formula for El Niño years (Surface temperature = -0.046204+ 0.016530*(year-1970)) yields the prediction that IF 2014 is an El Niño year, then the annual average surface temperature anomaly would be 0.68ºC (± 0.27ºC 95% confidence interval). The previous warmest year in the Berkeley Earth surface record is 2004, with an anomaly of 0.642ºC. Not only would that make 2014 the warmest year on record but also the warmest El Niño year on record.
Without an El Niño, the overall rate is a better predictor than the neutral rate for reasons I stated above. In the absence of an El Niño, then the predicted annual average for 2014 is 0.65ºC, with a 95% confidence interval of 0.56ºC to 0.75ºC. Still higher than 2004's record high but slightly lower than the El Niño scenario.
If we stay in a near La Niña state, as 2012 and 2013 were, then obviously surface temperature will be lower. In that situation, the best estimate would be the La Niña regression, which yields a predicted temperature of 0.56ºC (± 0.12ºC 95% confidence interval).

There you have it. Three predicted temperatures based on different ENSO conditions, all with the caveat that they were generated by pure statistical models, not a physical or quasi-empirical model. But regardless of which prediction is closest to being correct, the overall message is that the world is still warming up, no matter the ENSO status.
I took Berkeley Earth land + ocean annual temperature data starting in 1970 and categorized each year as El Niño, La Niña, or neutral using average MEI data for each year. Any year with an MEI average ≥ +0.5 was classed as an El Niño year. La Niña years had MEI values ≤ -0.5, whereas neutral years were between -0.5 and +0.5. I then performed a separate linear regression on each category.
This criterion isn't perfect—it misses the weaker El Niño/Southern Oscillation (ENSO) events. The El Niño of 2009–2010, for instance, doesn't register as an El Niño at all, with a classification of neutral for both 2009 and 2010. This means that my regression analysis of both El Niño and La Niña will be based primarily on only the strongest events whereas the neutral category will capture the weaker El Niño and La Niña events as well as truly neutral years. Given the propensity for weak El Niños in the last decade, this means that the regression for the neutral category overestimates the actual rate of warming during ENSO neutral years due to the influential point effect.
| Category | Rate of warming since 1970 ± 95% confidence interval |
| El Niño | 0.1653 ± 0.0618ºC per decade |
| Neutral | 0.1777 ± 0.0339ºC per decade |
| La Niña | 0.1467 ± 0.0283ºC per decade |
| Overall | 0.1655 ± 0.0221ºC per decade |
Note that surface temperatures rose regardless of ENSO conditions. If surface warming was primarily due to ENSO as some deniers have argued, then we'd expect surface warming to occur primarily during El Niños and little to no change in temperatures over time during La Niñas. The fact that surface temperatures rose during both El Niños and La Niñas refutes that argument. It's also interesting to note that the rate of surface warming during neutral ENSO conditions is faster than either the overall rate or the rate during El Niño events. I personally would have expected that El Niño events would have shown the fastest rate of surface warming.
Using the regression formula for El Niño years (Surface temperature = -0.046204+ 0.016530*(year-1970)) yields the prediction that IF 2014 is an El Niño year, then the annual average surface temperature anomaly would be 0.68ºC (± 0.27ºC 95% confidence interval). The previous warmest year in the Berkeley Earth surface record is 2004, with an anomaly of 0.642ºC. Not only would that make 2014 the warmest year on record but also the warmest El Niño year on record.
Without an El Niño, the overall rate is a better predictor than the neutral rate for reasons I stated above. In the absence of an El Niño, then the predicted annual average for 2014 is 0.65ºC, with a 95% confidence interval of 0.56ºC to 0.75ºC. Still higher than 2004's record high but slightly lower than the El Niño scenario.
If we stay in a near La Niña state, as 2012 and 2013 were, then obviously surface temperature will be lower. In that situation, the best estimate would be the La Niña regression, which yields a predicted temperature of 0.56ºC (± 0.12ºC 95% confidence interval).
There you have it. Three predicted temperatures based on different ENSO conditions, all with the caveat that they were generated by pure statistical models, not a physical or quasi-empirical model. But regardless of which prediction is closest to being correct, the overall message is that the world is still warming up, no matter the ENSO status.


Nice bit of analysis....
ReplyDeletePeer-review would point out that that the number of significant figures you quote is on the high side, but science types tend to be anal about that stuff....
If a major El Nino develops, I think your call for record temps will be bang on and hoepfully it will put that 17 year nonsense to rest...
This comment has been removed by the author.
Delete[Nice bit of analysis....]
DeleteThank you.
[Peer-review would point out that that the number of significant figures you quote is on the high side, but science types tend to be anal about that stuff....]
Quite true. I've altered the significant figures in the predicted temperatures down to two figures in response.
[If a major El Nino develops, I think your call for record temps will be bang on and hoepfully it will put that 17 year nonsense to rest...]
Hope springs eternal. Unfortunately, what many of the deniers will do is start saying "No warming since 2004" or "No warming since 2010" or whatever start point gives a non-significant trend.
This climate information is very helpful, thank you ..
ReplyDeleteAn interesting discussion is worth comment. I think that you should write more on this topic, it might not be a taboo subject but generally people are not enough to speak on such topics. To the next. Cheers
ReplyDelete