Hottest years-to-date on record
Back in August, I wrote a post that found the January-June period was the third hottest on record (based on the Cowtan-Way data set which corrects the coverage bias in HadCRUT4 data). This post will revise and update that earlier article, incorporating GISS, UAH, NCDC, HadCRUT4, and Cowtan-Way data sets. I am not including RSS, as that data set has shown false cooling since 2000.
First, here are the rankings for hottest five years to date for each data set. Note: HadCRUT4 and coverage-corrected HadCRUT4 data only extends to September whereas GISS, UAH, and NCDC all go to October.
2014 ranks as the second hottest year-to-date for both GISS and coverage-corrected HadCRUT4, the hottest year-to-date for the NCDC data set, and the third hottest year-to-date for both UAH and HadCRUT4. As it now stands, 2014 will be the hottest non-El Niño year on record in every temperature data set and would also be hotter than most El Niño years.
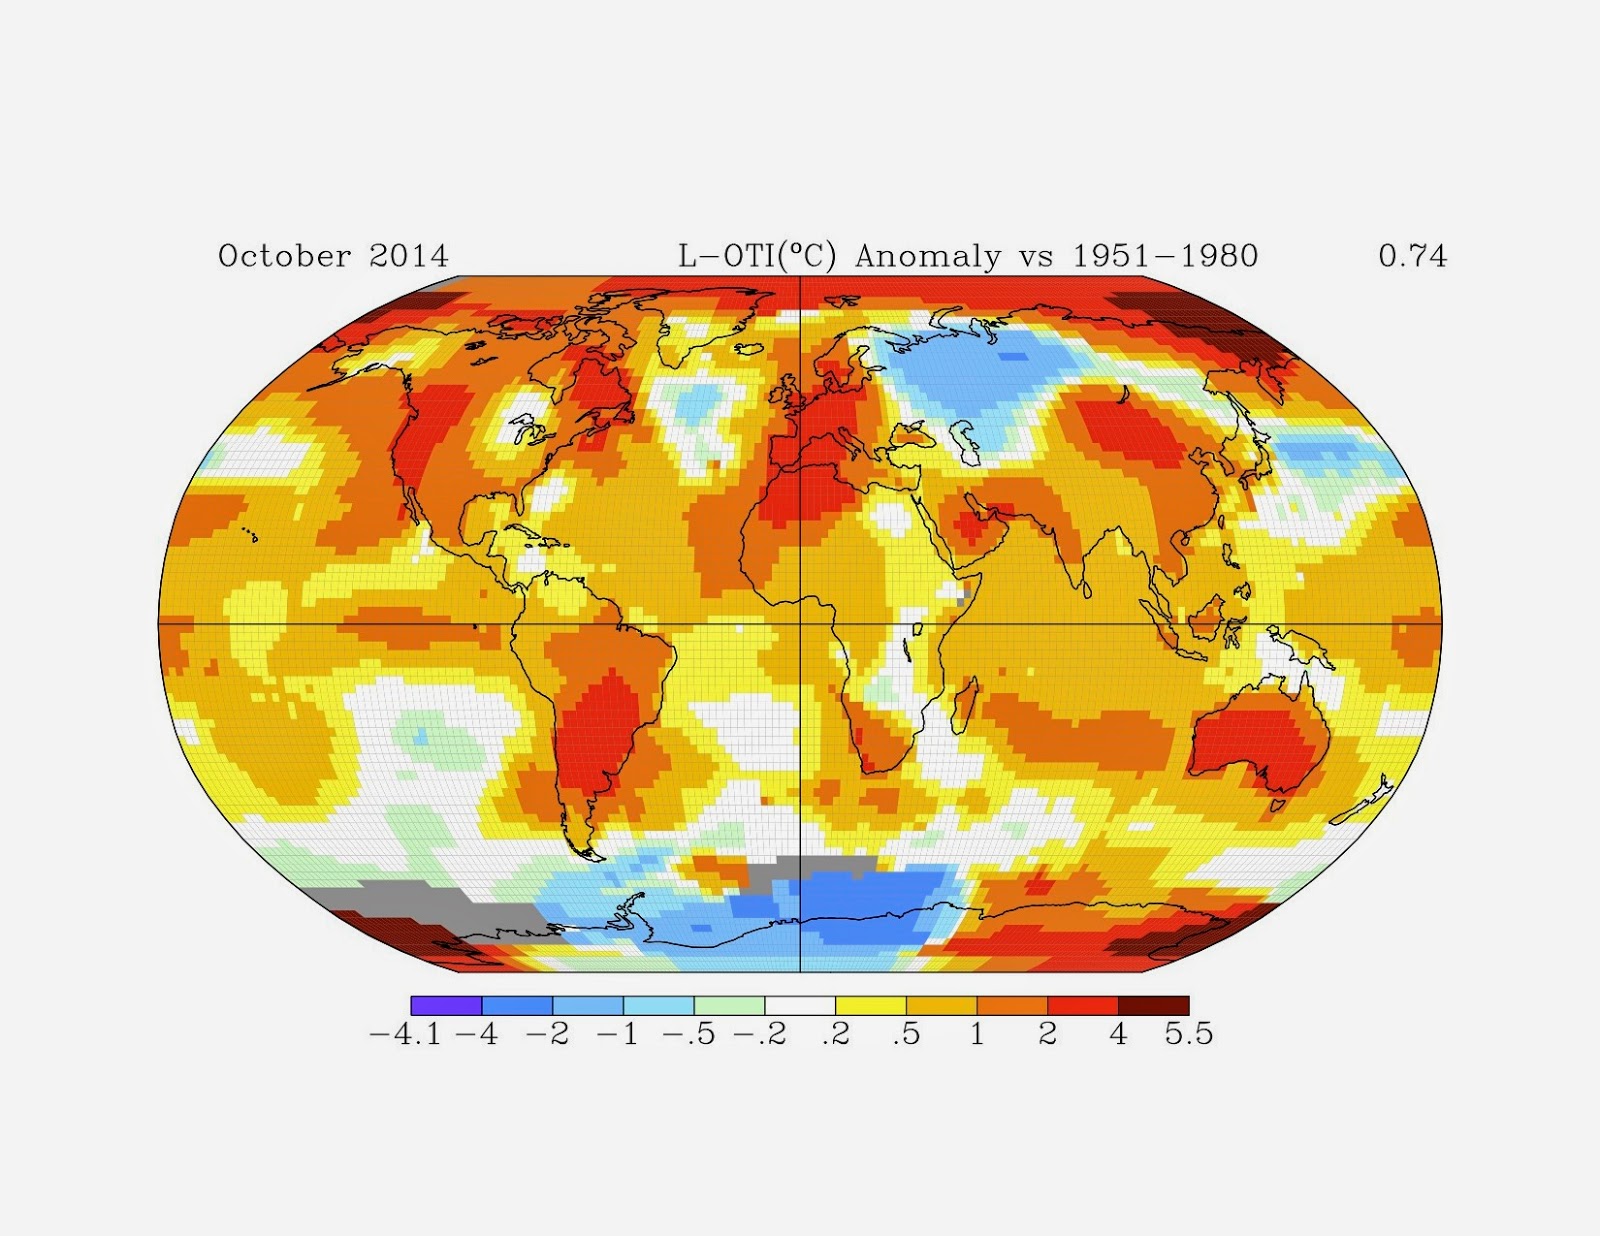
One argument I heard frequently over Thanksgiving (my own father is a global warming denier, which made for some...interesting conversations) was "How can we have global warming if we (meaning the central and eastern USA) are so cold?" The short answer to this type of question: The USA is not the entire world. There's a lot more to the planet than just the central and eastern USA.
I'll update this post with the November 2014 GISS temperature map once it's available. What's clear from the October map is that up to that point, the US was not particularly cold—and neither was the rest of the planet.
First, here are the rankings for hottest five years to date for each data set. Note: HadCRUT4 and coverage-corrected HadCRUT4 data only extends to September whereas GISS, UAH, and NCDC all go to October.
| Year to date temperature anomalies from five global data sets | ||||||||||
|---|---|---|---|---|---|---|---|---|---|---|
| GISS | UAH | NCDC | HadCRUT4 | Corrected HadCRUT4 | ||||||
| Rank | Year | Temp | Year | Temp | Year | Temp | Year | Temp | Year | Temp |
| 1 | 2010 | 0.675 | 1998 | 0.477 | 2014 | 0.679 | 1998 | 0.585 | 2010 | 0.655 |
| 2 | 2014 | 0.664 | 2010 | 0.440 | 2010 | 0.663 | 2010 | 0.584 | 2014 | 0.605 |
| 3 | 2005 | 0.651 | 2014 | 0.265 | 1998 | 0.659 | 2014 | 0.560 | 2007 | 0.596 |
| 4 | 2007 | 0.645 | 2005 | 0.263 | 2005 | 0.645 | 2005 | 0.536 | 2005 | 0.575 |
| 5 | 1998 | 0.635 | 2007 | 0.238 | 2002 | 0.621 | 2002 | 0.530 | 1998 | 0.575 |
2014 ranks as the second hottest year-to-date for both GISS and coverage-corrected HadCRUT4, the hottest year-to-date for the NCDC data set, and the third hottest year-to-date for both UAH and HadCRUT4. As it now stands, 2014 will be the hottest non-El Niño year on record in every temperature data set and would also be hotter than most El Niño years.
One argument I heard frequently over Thanksgiving (my own father is a global warming denier, which made for some...interesting conversations) was "How can we have global warming if we (meaning the central and eastern USA) are so cold?" The short answer to this type of question: The USA is not the entire world. There's a lot more to the planet than just the central and eastern USA.
I'll update this post with the November 2014 GISS temperature map once it's available. What's clear from the October map is that up to that point, the US was not particularly cold—and neither was the rest of the planet.


Comments
Post a Comment