Christopher Booker doesn't understand trends
Christopher Booker, a journalist for The Telegraph in England, has a long history of disputing scientific facts. Not only does he dispute climate change, he also disputes the link between smoking and cancer (hey, he fits right in with Heartland Institute) and the negative effects of asbestos. On May 6, 2017, he published yet another column on climate change proclaiming that all is well.
Titled "Another Arctic ice panic is over as world temperatures plummet", it has been quickly picked up by the usual science denial websites. As usual. Never mind that it's chock full of misinformation and outright ignorance. Let's get started.
First up, the selected facts present in the following paragraph in his article:
 The real howlers, though, is Booker's claim about Arctic sea ice extent and thickness this past April. You see, this past April tied for the lowest April sea ice extent on record at 13.83 million square kilometers (data courtesy of the National Snow and Ice Data Center). That's 370000 square kilometers lower than April 2004 (14.20 million square kilometers). That's far from stable as Paul Homewood claims on his blog. Even Homewood's own graph shows Arctic sea ice extent in April declining by an average of 42000 square kilometers per year, surprisingly higher than the -38000 km2 per year decline I calculate. However, whether the decline is -42000 km2 or -38000 km2 per year, April ice extent has been far from stable, regardless of how much Homewood manipulates his y-axis to hide the decline. Even better? Homewood's graphs don't go to April 2017. Apparently, Booker missed that bit of information printed on Homewood's graphs.
 And Arctic sea ice thickness is likewise at record lows for this time of year, about 1.6 m thick rather than the 2 m claimed.

Lastly, his claim of Greenland ice volume: Surface mass balance (the graph Homewood displays) is not volume. Even Homewood does not make that mistake. Simply put, a lot of fresh snow has on Greenland — snow that is already melting.

Second? The "logic" he used in the following paragraph:
Let's say that I have a data set of fictional temperature anomalies. The beginning point starts at 1ºC, then falls to 0.4ºC before slowly rising over 19 years before peaking at 3ºC, then falling to 2.4ºC. Using Booker's logic, because temperature fell 0.6ºC at both the beginning and the end, there was no change in temperature during those 19 years. However, you can clearly see that there was a rise of 2ºC in the baseline. Just because temperatures fell by roughly the same amount from an El Niño-fueled peak does not mean that there was no change in the underlying baseline — in other words, a trend — in the data.
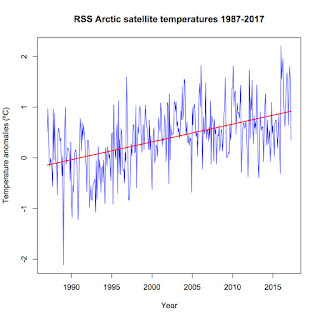
 Switching to actual satellite data (RSS Total Troposheric Temperature provided by Remote Sensing Systems), we find the same pattern: El Niño-fueled peaks in 1998 and 2016, followed by a decline of ~0.6ºC. Unfortunately for Booker's argument, however, there is a change in the baseline between the 1997-1998 and 2016 El Niño, despite the fact that temperatures fell almost the same amount after the respective El Niño ended, changing at the rate of 0.169ºC per decade (p-value = 0.0063).

In fact, there's a shift of just over 0.32ºC in the baseline between the 1997-1998 El Niño and the 2016 El Niño. That's why the peak in global temperatures from the 2016 event was higher than the peak of the 1997-1998 event, despite the 1997-1998 event being the stronger El Niño.
 In short, Booker's assertion that there is no change in temperatures just because global temperatures have now come off recent El Niño-caused peak is pure bull.
Frankly, Booker has been hoodwinked. He has no academic background or experience in analyzing or interpreting data and cannot even read graphs correctly, not even the printed end points. He depends on whatever Homewood includes — or doesn't — on his blog. Take his writings with a large grain of salt.
Titled "Another Arctic ice panic is over as world temperatures plummet", it has been quickly picked up by the usual science denial websites. As usual. Never mind that it's chock full of misinformation and outright ignorance. Let's get started.
First up, the selected facts present in the following paragraph in his article:
"But last week we were brought back to earth by the Danish Meteorological Institute (DMI), as charted by our friend Paul Homewood on his blog Notalotofpeopleknowthat, with the news that ever since December temperatures in the Arctic have consistently been lower than minus 20 C. In April the extent of Arctic sea ice was back to where it was in April 13 years ago. Furthermore, whereas in 2008 most of the ice was extremely thin, this year most has been at least two metres thick. The Greenland ice cap last winter increased in volume faster than at any time in years.All right, something to work with. Let's start with his first factual statement "...ever since December temperatures in the Arctic have consistently been lower than minus 20 C." That comes almost word-for-word from his source, Paul Homewood. Both Homewood and Booker nicely ignores that it's normally that cold. And they completely ignore the overall trend in the data. You know, the little warming trend that clocks in at 0.351ºC per decade over the past three decades. Yeah, that one.


Lastly, his claim of Greenland ice volume: Surface mass balance (the graph Homewood displays) is not volume. Even Homewood does not make that mistake. Simply put, a lot of fresh snow has on Greenland — snow that is already melting.

Second? The "logic" he used in the following paragraph:
"As for those record temperatures brought in 2016 by an exceptionally strong El Niño, the satellites now show that in recent months global temperatures have plummeted by more that [sic] 0.6 degrees: just as happened 17 years ago after a similarly strong El Niño had also made 1998 the "hottest year on record".
This means the global temperature trend has now shown no further warming for 19 years."In essence, he claims that because global temperatures have fallen 0.6ºC from their recent El Niño-fueled peak and the same drop occurred in 1998 after that El Niño peaked, then temperatures have not risen during the intervening 19 years. The logical fallacy is that Booker ignores changes in the baseline. in the intervening 19 years. Let's do a simple illustration.
Let's say that I have a data set of fictional temperature anomalies. The beginning point starts at 1ºC, then falls to 0.4ºC before slowly rising over 19 years before peaking at 3ºC, then falling to 2.4ºC. Using Booker's logic, because temperature fell 0.6ºC at both the beginning and the end, there was no change in temperature during those 19 years. However, you can clearly see that there was a rise of 2ºC in the baseline. Just because temperatures fell by roughly the same amount from an El Niño-fueled peak does not mean that there was no change in the underlying baseline — in other words, a trend — in the data.


In fact, there's a shift of just over 0.32ºC in the baseline between the 1997-1998 El Niño and the 2016 El Niño. That's why the peak in global temperatures from the 2016 event was higher than the peak of the 1997-1998 event, despite the 1997-1998 event being the stronger El Niño.

Frankly, Booker has been hoodwinked. He has no academic background or experience in analyzing or interpreting data and cannot even read graphs correctly, not even the printed end points. He depends on whatever Homewood includes — or doesn't — on his blog. Take his writings with a large grain of salt.


Thanks for the analysis,
ReplyDeletea simple case of ignorance and cherry-picking from the deniers
plus ça change
Usually I never comment on blogs but your article is so convincing that I never stop myself to say something about it. You’re doing a great job Man,Keep it up.
ReplyDeletestudy in canada consultants in delhi
Canada Student Visa Requirements in 2021
Overseas Education Consultants in Delhi
Really interesting breakdown of digital identity and interaction! It’s crucial to reflect on how we present ourselves online.
ReplyDeletehttps://blogs.ubc.ca/marcusfeldthus/2014/09/18/the-digital-people-who-are-we-dealing-with/#comment-1711