Posts

Showing posts with the label Climate change

Global temperature widget

Image
 I've created a web-based app that calculates linear regression trends on the Cowtan-Way global temperature data set  using annual mean temperature. The reason I picked that particular data set is simply that it's one of the easiest of the surface temperature data sets to download to R.  I chose annual data because red noise is insignificant at that scale so we can go with linear regression without worrying about autoregression. The app was made using the Shiny app in R Studio. When you open the app, you're greeted by a single page with two input boxes on the left-hand side. You enter the start year in the top box and end year in the bottom box and the Shiny app does the rest. The output includes the linear temperature trend per 100 years, the 95% confidence interval for that trend, a graph of the data and trend, complete with 95% confidence interval lines, and at the bottom the actual R output listing the model and fit statistics like the R 2 statistic.  I've demon...
Using NOAA's Climate-at-a-glance widget to fact-check James Taylor

Image
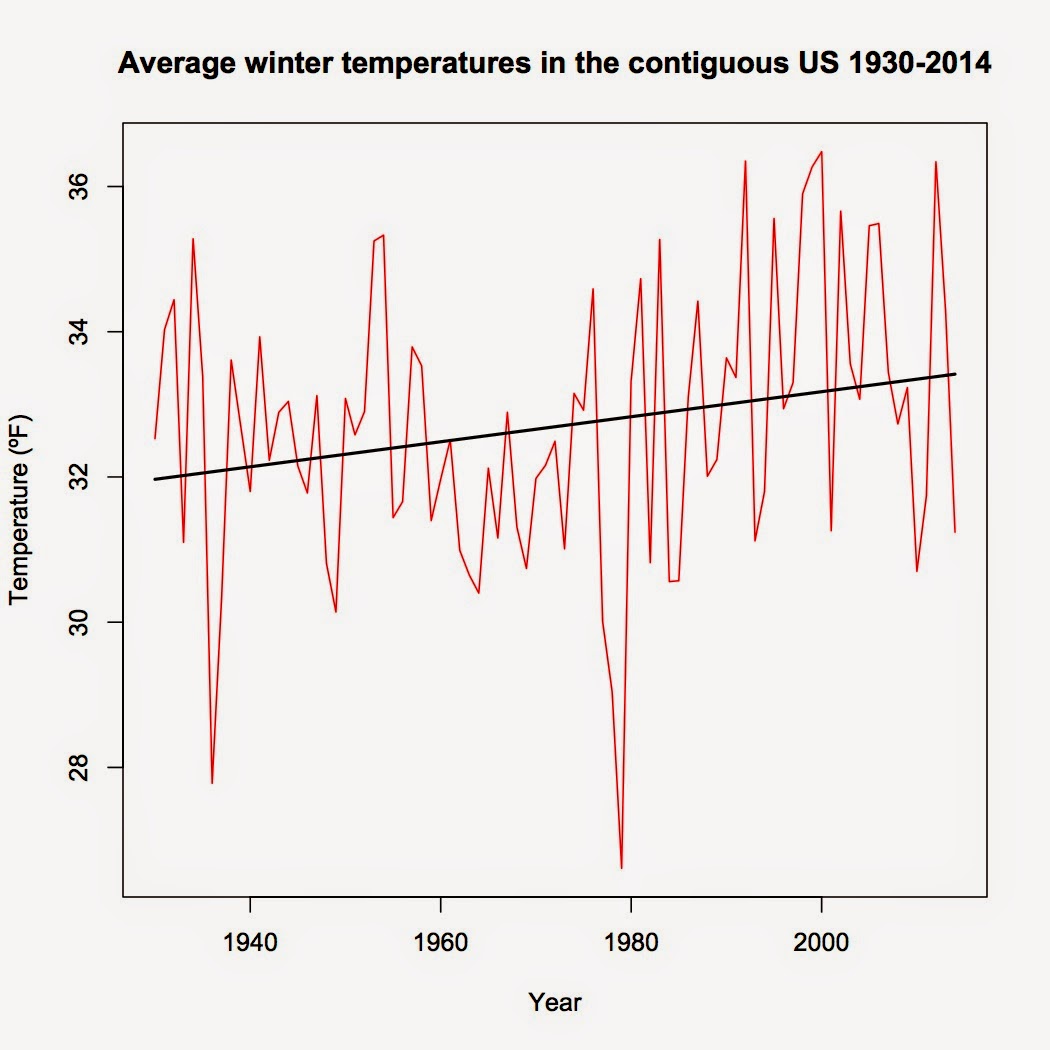
Okay, I'm back.  Sorry for the lengthy gap between posts but work and losing my laptop intervened.  Now to get back in the saddle. A reader by the pen name of cosmicomic asked several questions on my last post concerning James Taylor's claims about winter-time cooling in the US.  Since NOAA's climate-at-a-glance widget didn't work properly for him, I thought I'd post a video of what one should see as well as expound on the bogus method Taylor used.  Specifically, I'll examine Taylor claim that winters in the US have cooled, with the cooling trend dating back to 1930. First, a very brief tutorial by yours truly on using NOAA's widget and what you should see when you do: Now, Taylor's claim that US winters have cooled since 1930 is already in trouble. The simple linear regression model done by the widget shows that US winters have warmed by an average of +0.18ºF/decade since 1930. ARMA time series regression shows that the warming trend since 193...

Crossing the boundaries

Image
In 2009, a paper was published that measured where humanity stood in respects to the safe operating boundaries for nine environmental parameters ( Rockström et al. 2009 ).  The nine they chose were climate change, ocean acidification, stratospheric ozone depletion, rate of biodiversity loss, biogeochemical cycles (specifically, the nitrogen and phosphorus cycles), global freshwater use, change in land use, atmospheric aerosol loading, and chemical pollution.  Using the Holocene as a baseline, they calculated threshold levels for each parameter that, when crossed, created a high risk for changes that would be damaging for human civilization.

Where is climate change headed?

Image
With the completion of yet another circle around the sun, it's time to take stock of where we're headed with global climate.  I'm going to do something that is somewhat risky—extend statistical models beyond the data range that was used to create them, but necessary if we want to see where current trends will take us in the future.

Extinction is forever

Image
Here's a study I missed when it first came out two weeks ago: Monastersky, R. 2014. Biodiversity: Life—a status report. Nature 516:159-161 . This report compiled all known data on species status.  The results are sobering.  Thousands of species are at risk of extinction, including: 41% of all known amphibians 26% of all known mammals 13% of all known birds Note: Those are the species currently at risk.  Today.  Not predicted to be at risk in the future.  Forty-one percent of all amphibians, 26% of all mammals, and 13% of all birds are already at risk of extinction today .  And those are the best known groups. The rest—insects, plants, fungi, fish, etc?  Unknown, as not enough species in those groups have been evaluated to even guess at the percentage currently at risk of extinction.

The non-existant pause in global temperatures

Image
Regular readers of this blog will know that I am skeptical of claims that global warming in atmospheric temperatures have paused since 1998, having written several posts questioning the existence of such a pause.  In this edition, I'll run down the main evidence that, in my opinion, show that the pause is a figment of the denialsphere's imagination.

Tom Luongo's multiple lies about climate change

Image
An old friend posted an " article " by Tom Luongo, a former chemist (B.S. from the University of Florida) who now writes the Resolute Wealth Newsletter, on Facebook.  Unfortunately, that article is chock full of lies about climate science.  Since Facebook comments aren't the best forum for debunking Gish Gallops, I'm taking the liberty of debunking them here. [Update: Since Luongo got most of his claims from John Casey, I've written something about his brand of science here .]

One hundred years ago today...

Image
...the last passenger pigeon, a female named Martha, died in the Cincinnati Zoo.  A species that once had an estimated population size of 3 billion was destroyed in roughly 50 years by a combination of habitat loss and overhunting.  The story of that extinction is being told in numerous articles on this centenary (i.e. in Nature , Audubon Magazine , National Geographic ) and at museums like the Smithsonian Institute which tell the story far better than I could here.  The Audubon Magazine article, in particular, is well worth reading as it details the history of the extinction.

Another denier trying to baffle with BS

Image
On Huffington Post, I was challenged by a denier going by the screen name "Shuman the Human".  You can read the exchange here .  It's incomplete as for some reason my attempts to reply to his comment keep getting zapped.  Update: Looks like HuffPost zapped his last comment as well.

A Republican Meteorologist on climate change

This one is too good not to share.  It's the response of Paul Douglas, a meteorologist who happens to be a registered Republican, to a question on why more climate scientists do not enter the public debate (full response found here ).  His take-home line? "To the heart of your question, why don’t more climate scientists enter into the public debate? Because the debate is over. It’s the moral and scientific equivalent of debating gravity." As readers who peruse the archives of this blog know, I've spent quite a bit of time detailing why the scientific debate is over.  However, I have one quibble with Douglas' response: He fails to distinguish between the scientific debate and the public debate.  The question concerned the public debate—and the public debate is far from over.  Given the scientific illiteracy of many American voters ( 26% of whom don't even know that the Earth revolves around the sun ), it's been easy for fossil fuel interests to spread ...

2013 climate review

Image
2013 was notable in several ways, from the record warmth in Australia to the polar vortex that gripped the Eastern US in November and December due to a weakened Arctic polar jet stream and record drought in the US state of California, along with numerous extreme weather events around the globe .

Polar vortex and global warming

Image
I've had several people to use the current cold weather in the US as "proof" that global warming isn't happening. Unfortunately for those arguments, they're pure bunk. First, the Eastern US and Canada do not represent the entire planet. The December 2013 global map of average temperature anomalies show this: While the eastern US and Canada are cold, the rest of the planet is relatively warm, with only a few areas (e.g. the Middle East) colder than the 1951-1980 average.  This same pattern has been in place since November 2013 and I expect that the January 2014 map won't change much.   [As expected, it did not.  Here's the January 2014 map:] Again, the Eastern US was far below average whereas the rest of the planet, especially much of the Arctic was far above average.]  This demonstrates the importance of looking at the global temperature data, rather than just the weather in your backyard when contemplating global warming. Second, th...

Anthropogenic climate change, evolution, and scientific theories

One of the common misconceptions about science is the nature of scientific theories.  Much of the confusion stems from the word "theory" having two very different definitions.  Among non-scientists, a theory is a guess, possibly an educated guess based on some facts, but a guess nonetheless.  It's little more than an opinion and less than a known fact (itself is usually taken to mean the unchanging truth) on the hierarchy of truth.  Skeptics often dismiss climate change and evolution with statements like "Human-caused global warming is just a theory, not a fact" or "Evolution is just a theory."  Those statements reveal that the person stating or writing them are using the non-scientific definition. In science, "fact" and "theory" have very different meanings from their nonscientific definitions.  "Facts" are data, discovered and verified via repeated observations and experiments to the point where it's ridiculous t...

One of the most common refrains...

Image
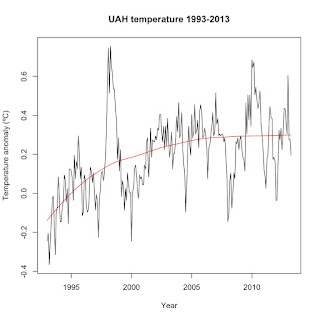
from climate skeptics is that the Earth hasn't warmed since 1998.  Why 1998?  Because that is the only start point that allows them to make that claim.  First, here's a graph of UAH since 1993, plotted to the 1981-2010 baseline and with a loess regression trend to highlight the trend:

How we know the extra CO2 comes from technology.

Image
In the last three posts, I've examined the evidence that the Earth is warming and that the warming is due to CO 2 .  Continuing this series, today I'll look at the evidence that shows that humans are behind the increase in CO 2 .

How we know global warming is because of CO2: Part 2

Image
After Joseph Fourier deduced the existence of the greenhouse effect in the 1820s, it took until 1861 before John Tyndall identified the first components of the greenhouse effect as water vapor and CO 2 ( Tyndall 1861 ).  One hundred fifty-two years of research later, we know far more about the absorptive properties of  CO 2  and other greenhouse gases , including water vapor, including how they affect Earth's infrared spectrum.

How we know global warming is because of CO2: Part 1

Image
The existence of Earth's greenhouse effect was first postulated by Joseph Fourier in the 1820s, when he calculated that the Earth should be much colder than it actually is.  Using the Stefan-Boltzmann law, and modern measurements, we can calculate what that temperature should be.  The equation for doing so is

One of the first questions...

Image
First, an introduction.  This blog will cover topics in ecology and environmental science.  That is, after all, my background.  I hold Bachelor's and Master's degrees in Biology, with emphasis on ecology, and am completing a Ph.D. in Environmental Science.  My research focus covers forest ecology but my training runs the gamut from calculating the spread and fate of pollutants in groundwater to creating watershed models to population ecology to ecosystem cycles.  My teaching experience is on the college level, having taught courses ranging from general biology to physiology to ecology, environmental science, and evolution. One of the first questions I'm usually asked when people find out my background is "Is global warming real?"  My answer is "Yes, it's real–and it's caused by humans."  In this post, I'll explore the data that shows that the Earth is warming.  I'll get into the data why we're the cause in subsequent posts.