One of the most common refrains...
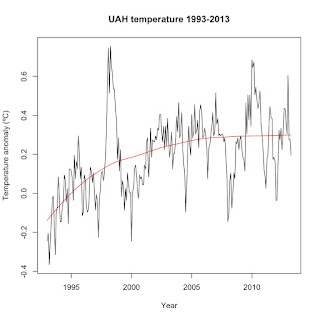
from climate skeptics is that the Earth hasn't warmed since 1998. Why 1998? Because that is the only start point that allows them to make that claim. First, here's a graph of UAH since 1993, plotted to the 1981-2010 baseline and with a loess regression trend to highlight the trend:
Why does starting at 1998 affect the trend that much, enough so that it's not statistically significant? Take a look.
1998 was the year of the most extreme El Niño event on record. It's far warmer than any of the years around it. Starting a trend at an anomalously warm year pulls the start point up, minimizing the amount of warming recorded by linear regression.
So why do skeptics claim that there's been no warming since 1998? Because it's the only year where they can start a linear regression line and get their desired result. That's the definition of cherry-picking.
There are other reasons why we know that global warming continues, despite the apparent leveling off since 2005, which I'll get into in the next post.
You can see that the trend has leveled off since around 2005, but that it clearly rose between 1998 and 2005. This isn't too surprising, nor does it mean that global warming has stopped since 2005. You can find several similar 20-year time periods over the last 40 years where atmospheric temperatures appear to have leveled off or even fall for short periods of time despite the overall warming trend. For instance, here's a look at the first full 20 years of the UAH satellite record:
You can do this with GISS or any of the other temperature datasets. All it shows is that by carefully choosing short chunks out of a larger dataset, you can make the data show anything, from warming to cooling–even a trend that looks more like a mustache on an old-time Hollywood movie villain than a trend. In science, carefully picking your start and end points to get the answer you want is called cherry-picking. And if you have to resort to cherry-picking to support your argument, it means that your argument was invalid to start with.
How does this apply to the "no warming since 1998" claim? When skeptics talk about "no warming," they're usually talking about linear regression trends, not loess regression trends. Linear regression gives trends that look like this:
Linear regression gives the average trend over the entire time period, ignoring the short-term fluctuations in the data that loess regression picks up. The linear regression trend shown in the above graph showed an average temperature rise of +0.010199ºC +/- 0.001984 per year between 1979 and 1999. And yes, that rise is statistically significant, with a p-value of 0.0000005566. For those who haven't taken a statistics course, that p-value means that there's a 1 in 1,796,622.35 chance that the trend is due to random chance. Normally, we say that a p-value of 0.05 (a 1 in 20 chance) is statistically significant, with a smaller p-value obviously better. Above 0.05, we chalk up the results to random chance and say that it's not statistically significant.
The main limitation with linear regression is that you need quite a bit of data before any trend will be statistically significant. Global temperatures fluctuate due to El Niño/La Niña, volcanic eruptions, etc. You need enough data so that regression can pick out the trend despite those fluctuations. Santer et al. (2011) showed that you need at least 17 years worth of data to reliably pick out linear regression trends in global temperature data. Get much below that and you run the risk of simply not having enough data. So with that background, let's look at the linear regression trends for different starting points:
Start year
|
Linear trend (ºC per year)
|
p-value
|
2000
|
0.011098
|
0.0005069
|
| 1999 | 0.014848 | 0.0000003344 |
| 1998 | 0.005549 | 0.05915 |
| 1997 | 0.009302 | 0.0006517 |
| 1996 | 0.012098 | 0.000001458 |
| 1995 | 0.012356 | 0.00000006008 |
| 1994 | 0.014259 | 0.00000000001891 |
| 1993 | 0.017354 | <0.00000000000000022 |


Comments
Post a Comment