Posts

Showing posts with the label linear regression

Global temperature widget

Image
 I've created a web-based app that calculates linear regression trends on the Cowtan-Way global temperature data set  using annual mean temperature. The reason I picked that particular data set is simply that it's one of the easiest of the surface temperature data sets to download to R.  I chose annual data because red noise is insignificant at that scale so we can go with linear regression without worrying about autoregression. The app was made using the Shiny app in R Studio. When you open the app, you're greeted by a single page with two input boxes on the left-hand side. You enter the start year in the top box and end year in the bottom box and the Shiny app does the rest. The output includes the linear temperature trend per 100 years, the 95% confidence interval for that trend, a graph of the data and trend, complete with 95% confidence interval lines, and at the bottom the actual R output listing the model and fit statistics like the R 2 statistic.  I've demon...

The "no warming" claim rises from the dead yet again.

Image
Like a movie vampire, this one keeps coming back no matter how many stakes are driven through its heart.  I've covered this one ( here , here , and here ).  Bluntly: There is absolutely no evidence that global warming has stopped.  For global warming to stop, the Earth's energy balance must be either zero or negative.  The most recent estimates for the energy imbalance are generally between +0.5 W/m 2 and +1.0 W/m 2 .  The only way the Earth is not going to warm while it is gaining energy is if the laws of thermodynamics magically do not apply.  If the Earth is gaining energy, some part of it, somewhere, must be getting warmer.  The heat must go into either melting ice, warming the oceans, warming the land, or warming the atmosphere (or some combination thereof).

A quick tutorial in R

Image
I've had a request for a quick tutorial on how to get started using R.  R is a statistical language that analyzes data and saves results in files called "objects."  You can then use the objects to create new analyses and objects.  Note: Wherever you see a "#", what follows is a comment.  You can delete that comment before running the code or leave it in—R ignores anything that follows a # sign.  Here's how I get my students started.

One of the most common refrains...

Image
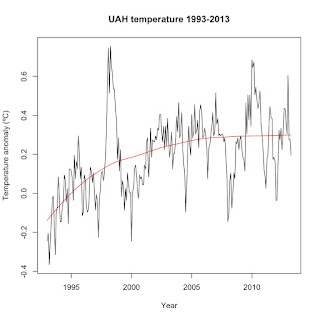
from climate skeptics is that the Earth hasn't warmed since 1998.  Why 1998?  Because that is the only start point that allows them to make that claim.  First, here's a graph of UAH since 1993, plotted to the 1981-2010 baseline and with a loess regression trend to highlight the trend: