First look: UAH 6.0 vs UAH 5.6 vs RSS
Spencer and Christy recently released a new version (version 6.0) of the UAH satellite temperature data. To see how their data has changed, I've compared the 6.0 version to the earlier 5.6 version and compared both to RSS, similar to what I did before. All calculations were made using annual data.
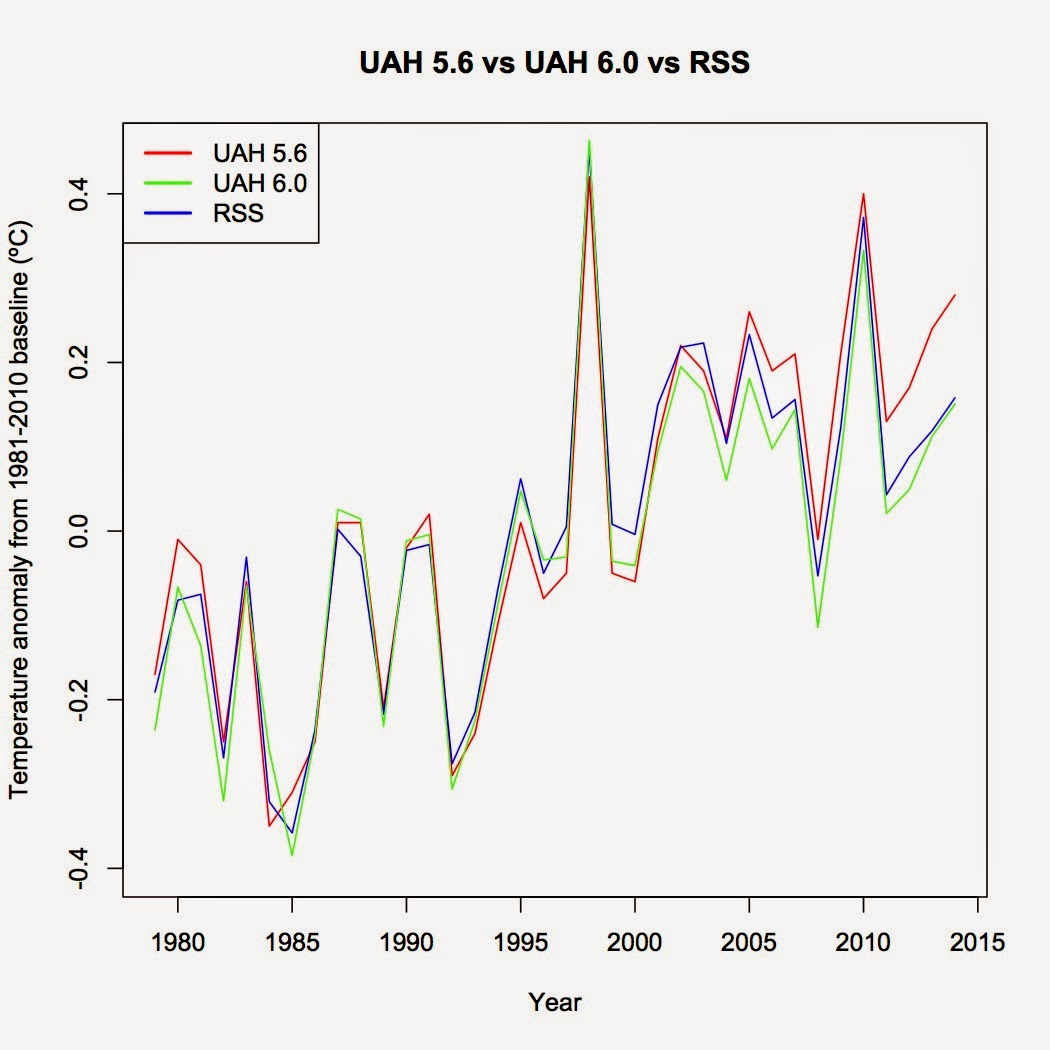
The difference between UAH 5.6 and UAH 6.0 is quite dramatic, especially since 2000, and the difference has grown over time.
Comparing both UAH versions to RSS shows that while version 5.6 was consistently warmer than RSS since 2003, version 6.0 has a tendency to run cooler than RSS since 1998.

The effect all the changes from 5.6 to 6.0 had on the calculated trend was drastic. Since 1990, the average version 6.0 trend is 0.0094ºC/year lower than the same trend in version 5.6. For version 5.6, only the trends since 1997, 1998, and 2000 were not statistically significant. For version 6, every trend since 1993 has not been significant.
Taking a closer look, land temperatures were nearly the same for both UAH versions.

Both versions have 2010 as the hottest year in the satellite record and show nearly the same linear trends. Note: Unless stated otherwise, all trends are given as trend ± standard error. For example, the two versions show nearly the same trend since 1979: 0.186 ± 0.028ºC/decade and 0.191 ± 0.028ºC/decade for versions 5.6 and 6.0 respectively. Yes, version 6.0 shows a faster overall rate of temperature rise over land than version 5.6. Where version 6.0 shows cooling relative to version 5.6 is over the oceans.

Here, notice how version 6.0 generally shows warmer temperatures up to 1998 than the version 5.6 and cooler temperatures afterwards? That's the reason UAH 6.0 shows less overall warming than UAH 5.6. While UAH 5.6 shows a warming rate of 0.111 ± 0.021ºC/decade over the oceans since 1979, UAH 6.0 shows a warming rate of only 0.083 ± 0.022ºC/decade over the oceans. Given that the oceans make up 71% of the surface area of this planet, that is enough to drop the overall global warming rate since 1979 from 0.139 ± 0.022ºC/decade in UAH 5.6 down to 0.113 ± 0.023ºC/decade in UAH 6.0.
There are a few other areas of interest to compare before I wrap this post up. Arctic temperature trends show a major drop, from 0.441 ± 0.052ºC/ decade in UAH 5.6 down to 0.235 ± 0.042ºC/decade in UAH 6.0.

The main reason for that drop is UAH 6.0 shows warmer temperatures in the early part of the satellite record relative to UAH 5.6 and cooler temperatures in the later portion. Finally, continental US temperatures trends declined in UAH 6.0 from 0.211 ± 0.052ºC/decade to 0.154 ± 0.045ºC/decade.

The difference in trends is not statistically significant, unlike the difference in the Arctic and the differences between temperatures is relatively minor.
In closing, I would recommend that everyone read Roy Spencer's summary of all the changes they made in UAH 6.0. It's very informative of the challenges of accurately measuring global temperatures via satellite, including a good summary of why various adjustments to the data are necessary.
The difference between UAH 5.6 and UAH 6.0 is quite dramatic, especially since 2000, and the difference has grown over time.
 |
| Difference calculated by subtracting annual version 6.0 values from the respective 5.6 values. |

The effect all the changes from 5.6 to 6.0 had on the calculated trend was drastic. Since 1990, the average version 6.0 trend is 0.0094ºC/year lower than the same trend in version 5.6. For version 5.6, only the trends since 1997, 1998, and 2000 were not statistically significant. For version 6, every trend since 1993 has not been significant.
 |
| Trend ± 95% confidence intervals for different start years. |
Taking a closer look, land temperatures were nearly the same for both UAH versions.

Both versions have 2010 as the hottest year in the satellite record and show nearly the same linear trends. Note: Unless stated otherwise, all trends are given as trend ± standard error. For example, the two versions show nearly the same trend since 1979: 0.186 ± 0.028ºC/decade and 0.191 ± 0.028ºC/decade for versions 5.6 and 6.0 respectively. Yes, version 6.0 shows a faster overall rate of temperature rise over land than version 5.6. Where version 6.0 shows cooling relative to version 5.6 is over the oceans.

Here, notice how version 6.0 generally shows warmer temperatures up to 1998 than the version 5.6 and cooler temperatures afterwards? That's the reason UAH 6.0 shows less overall warming than UAH 5.6. While UAH 5.6 shows a warming rate of 0.111 ± 0.021ºC/decade over the oceans since 1979, UAH 6.0 shows a warming rate of only 0.083 ± 0.022ºC/decade over the oceans. Given that the oceans make up 71% of the surface area of this planet, that is enough to drop the overall global warming rate since 1979 from 0.139 ± 0.022ºC/decade in UAH 5.6 down to 0.113 ± 0.023ºC/decade in UAH 6.0.
There are a few other areas of interest to compare before I wrap this post up. Arctic temperature trends show a major drop, from 0.441 ± 0.052ºC/ decade in UAH 5.6 down to 0.235 ± 0.042ºC/decade in UAH 6.0.

The main reason for that drop is UAH 6.0 shows warmer temperatures in the early part of the satellite record relative to UAH 5.6 and cooler temperatures in the later portion. Finally, continental US temperatures trends declined in UAH 6.0 from 0.211 ± 0.052ºC/decade to 0.154 ± 0.045ºC/decade.

The difference in trends is not statistically significant, unlike the difference in the Arctic and the differences between temperatures is relatively minor.
In closing, I would recommend that everyone read Roy Spencer's summary of all the changes they made in UAH 6.0. It's very informative of the challenges of accurately measuring global temperatures via satellite, including a good summary of why various adjustments to the data are necessary.
Many of the same adjustment challenges apply to surface data, making this a useful reference for those who claim that various agencies are fudging the surface data with their adjustments.
"One might ask, Why do the satellite data have to be adjusted at all? If we had satellite instruments that (1) had rock-stable calibration, (2) lasted for many decades without any channel failures, and (3) were carried on satellites whose orbits did not change over time, then the satellite data could be processed without adjustment. But none of these things are true. Since 1979 we have had 15 satellites that lasted various lengths of time, having slightly different calibration (requiring intercalibration between satellites), some of which drifted in their calibration, slightly different channel frequencies (and thus weighting functions), and generally on satellite platforms whose orbits drift and thus observe at somewhat different local times of day in different years. All data adjustments required to correct for these changes involve decisions regarding methodology, and different methodologies will lead to somewhat different results. This is the unavoidable situation when dealing with less than perfect data."


Comments
Post a Comment