Posts

Showing posts from 2017

Christopher Booker doesn't understand trends
Image
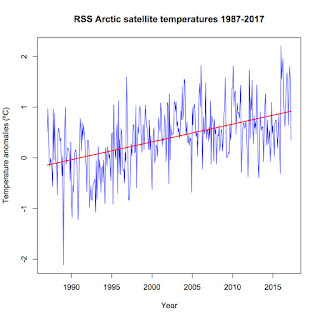
Christopher Booker, a journalist for The Telegraph in England, has a long history of disputing scientific facts. Not only does he dispute climate change, he also disputes the link between smoking and cancer (hey, he fits right in with Heartland Institute) and the negative effects of asbestos. On May 6, 2017, he published yet another column on climate change proclaiming that all is well. Titled " Another Arctic ice panic is over as world temperatures plummet ", it has been quickly picked up by the usual science denial websites. As usual. Never mind that it's chock full of misinformation and outright ignorance. Let's get started. First up, the selected facts present in the following paragraph in his article:  "But last week we were brought back to earth by the Danish Meteorological Institute (DMI), as charted by our friend Paul Homewood on his blog Notalotofpeopleknowthat, with the news that ever since December temperatures in the Arctic have consistently be...

Meltdown: An early prediction of September 2017 Actic sea ice extent

Image
Yes, I'm a bit late but the Arctic is in full meltdown this year. I crunched the numbers for April ice extent and found that this past April saw the second-lowest Arctic sea ice extent on record. Since 1979, average sea ice extent in April has declined by 1,403,600 square kilometers, an area nearly the size of Alaska and over twice the size of Texas. (Alaska has an area of 1,717,854 square kilometers and Texas comes in at 696,241 square kilometers. You can find a list of all 50 states at ThoughtCo.com in case you're curious). Even more worrisome is the record low average extent in the first four months of this year. Average monthly January to April extent has fallen by 1,626,860 square kilometers since 1979. This record low comes in spite of neutral ENSO conditions, indicating that something has changed in the Arctic and not for the better. Sea ice volume makes the point even more clear. So far, sea ice volume is setting new record lows, meaning there is a lot of th...

R code for Shifting Bell Curves

Image
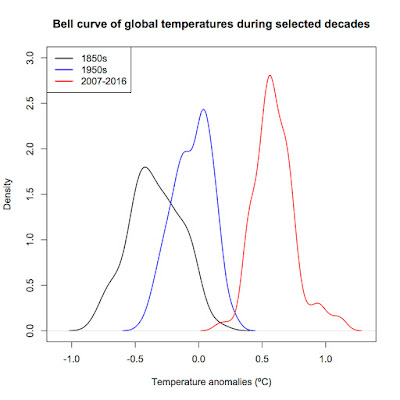
A commentator named Jonathan asked for the code by which I produced my bell curve graph way back in 2013. Here it is. Note : I'm using the Cowtan and Way 2.0 temperature reconstruction in this example rather than NASA GISS as in the original post as the Cowtan and Way data is more accessible for use in R. >Cowtan<-read.table("http://www-users.york.ac.uk/~kdc3/papers/coverage2013/had4_krig_v2_0_0.txt", header=F) > names(Cowtan)<-c("Year", "Temperature", "Uncertainty1", "Uncertainty2", "Uncertainty3") #Name the columns > summary(Cowtan) #Check to see if the column names look right and the data imported correctly > S1850s<-subset(Cowtan, Year<1860) #Get subsets of each decade > S1950s<-subset(Cowtan, Year>=1950 & Year<1960) > S2007<-subset(Cowtan, Year>=2007 & Year<2017) > D1850s=density(S1850s$Temperature) #Get the density kernals > D1950s<-density(S1...

Mt. Etna vs Humans

Image
Yes, I'm still around. I've just been fairly busy the past few months. The long-debunked myth that Mt. Etna emits more carbon dioxide in one little eruption than human activities have for our entire history as a species has recently reappeared on my social media feed, courtesy of a right-wing cousin of mine.  I just thought I'd do a quick comparison showing just how wrong that myth is. Using data from tables 2 and 3 in Burton, Sawyer, and Granieri (2013) for volcanic emissions and Boden, Marland, and Andres (2017) for human-related carbon dioxide emissions, I get the following comparison between an entire year's worth of Mt. Etna CO 2 emissions and just one year's worth of human-caused CO 2 emissions. Mt. Etna produces an average of 7.22 million metric tons of CO 2 per year. That's TOTAL per year, not just "one little burp." In contrast, humans caused 36.14 BILLION metric tons of CO 2 emissions in 2014 alone. Mt. Etna emissions aren...