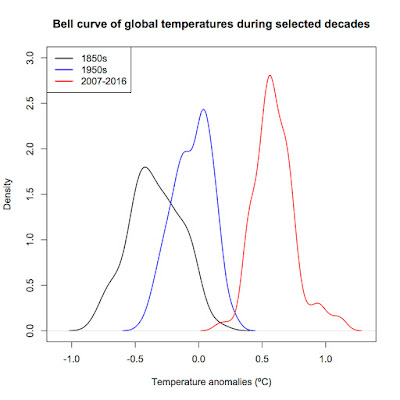
R code for Shifting Bell Curves
A commentator named Jonathan asked for the code by which I produced my bell curve graph way back in 2013. Here it is. Note: I'm using the Cowtan and Way 2.0 temperature reconstruction in this example rather than NASA GISS as in the original post as the Cowtan and Way data is more accessible for use in R.
>Cowtan<-read.table("http://www-users.york.ac.uk/~kdc3/papers/coverage2013/had4_krig_v2_0_0.txt", header=F)
> names(Cowtan)<-c("Year", "Temperature", "Uncertainty1", "Uncertainty2", "Uncertainty3") #Name the columns
> summary(Cowtan) #Check to see if the column names look right and the data imported correctly
> S1850s<-subset(Cowtan, Year<1860) #Get subsets of each decade
> S1950s<-subset(Cowtan, Year>=1950 & Year<1960)
> S2007<-subset(Cowtan, Year>=2007 & Year<2017)
> D1850s=density(S1850s$Temperature) #Get the density kernals
> D1950s<-density(S1950s$Temperature)
> D2007<-density(S2007$Temperature)
> plot(D1850s, main="Bell curve of global temperatures during selected decades", xlab="Temperature anomalies (ºC)",xlim=c(-1.1,1.3), ylim=c(0,3), lwd=1.5)
> points(D2007, type="l",col="red", lwd=1.5)
> points(D1950s, type="l",col="blue", lwd=1.5)
> legend("topleft", legend=c("1850s", "1950s", "2007-2016"), col=c("black", "blue", "red"), lwd=2)


Look at the way my pal Wesley Virgin's report starts in this SHOCKING and controversial VIDEO.
ReplyDeleteWesley was in the military-and soon after leaving-he unveiled hidden, "SELF MIND CONTROL" tactics that the government and others used to get whatever they want.
As it turns out, these are the same secrets tons of famous people (especially those who "became famous out of nowhere") and the greatest business people used to become rich and successful.
You've heard that you utilize only 10% of your brain.
That's mostly because most of your brain's power is UNCONSCIOUS.
Maybe this conversation has even occurred INSIDE OF YOUR very own brain... as it did in my good friend Wesley Virgin's brain seven years ago, while riding an unregistered, beat-up trash bucket of a car without a driver's license and $3 in his bank account.
"I'm absolutely frustrated with living paycheck to paycheck! When will I finally make it?"
You've taken part in those conversations, isn't it right?
Your own success story is waiting to be written. Go and take a leap of faith in YOURSELF.
UNLOCK YOUR SECRET BRAINPOWER