Posts

Showing posts with the label NCDC

Hottest years-to-date on record

Image
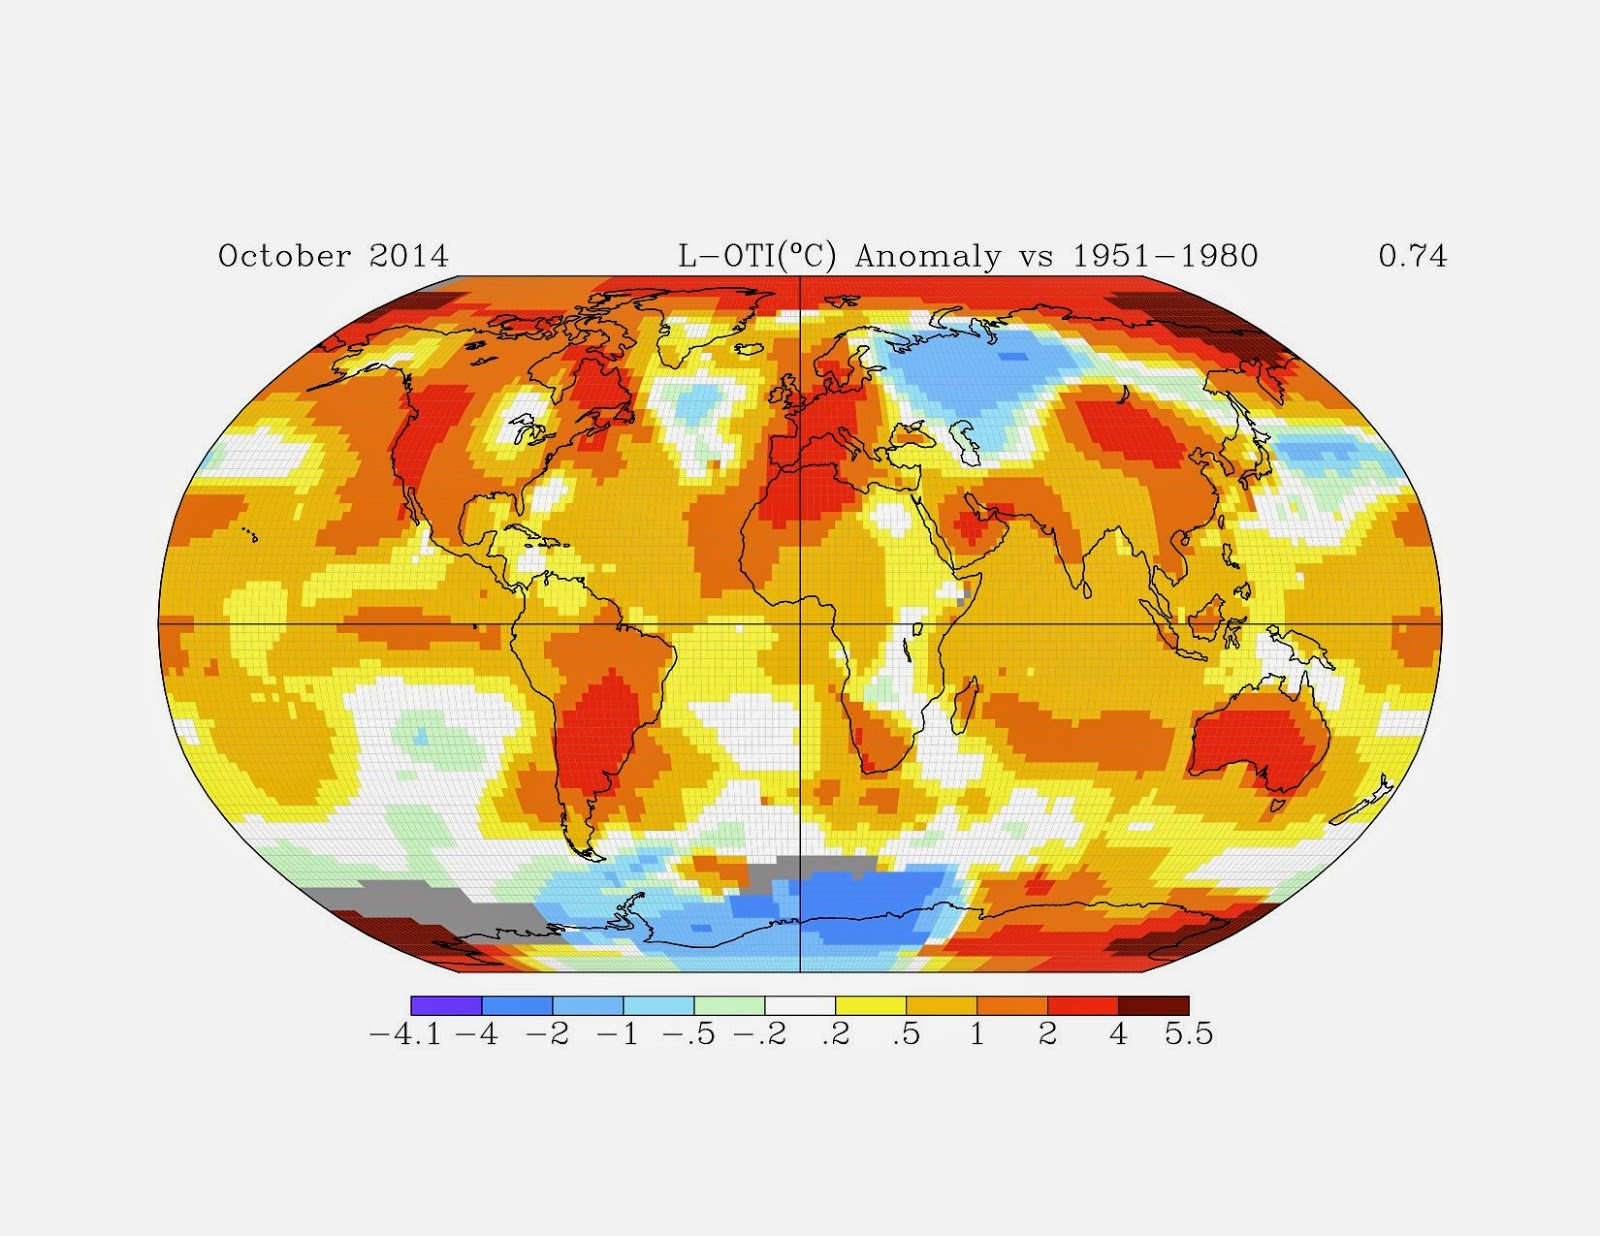
Back in August, I wrote a post that found the January-June period was the third hottest on record ( based on the Cowtan-Way data set which corrects the coverage bias in HadCRUT4 data).  This post will revise and update that earlier article, incorporating GISS, UAH, NCDC, HadCRUT4, and Cowtan-Way data sets.  I am not including RSS, as that data set has shown false cooling since 2000.

Rates of change

Image
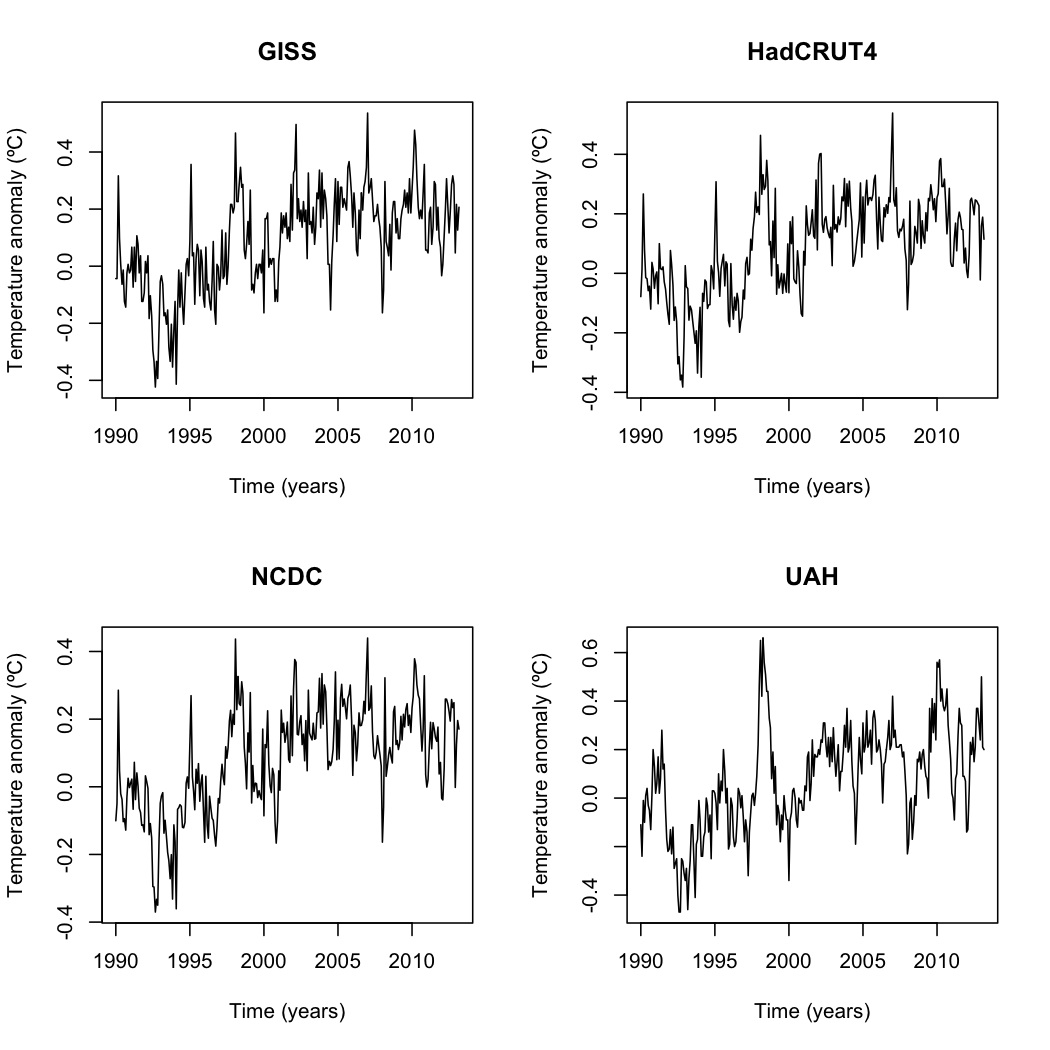
One common misunderstanding about how the current global warming differs from past episodes of warming is the rate of warming.  In this post, I'll show how the rate over the past 30 years stacks up with two of the better-known rates from geologic history. Past 30 years (1983-2013) rate ± standard error: UAH: +0.015379 ± 0.003783ºC per year GISS: +0.015505 ± 0.002491ºC per year NCDC: +0.014454 ± 0.002489ºC per year HadCRUT4: +0.014896 ± 0.002824ºC per year Depending on the data set, the rate of the last 30 years ranges from 0.014454ºC per year up to 0.015505ºC per year.  When I average the four data sets together then calculate the rate, the result is +0.014692 ± 0.003070ºC per year for the last 30 years. For the geologic rates, let's start with the most recent and work backwards in time. Over the 5,000 years since the end of the Holocene Climatic Optimum, the Earth slowly cooled by 0.7ºC ( Marcott et al. 2013 ).  That's an average rate of  -0.00014ºC...

Revisiting the question of "Has global warming stopped since 1998?"—again.

Image
Let me be blunt: There is little evidence that global warming stopped in 1998 or any year thereafter.  Most of the evidence we have, from the energy imbalance to total heat content to ocean heat content, show that global warming continues, as I previously explained here , here , and here .  The only piece of evidence that appears to show that global warming has stopped is that the trend in surface temperature data is not statistically significant in recent years.  However, that is at best ambiguous.  No significant trend could mean that warming continues but short-term variation in the data masks the trend, that there's no warming or that there's a cooling trend but not enough data for that to be significant.  There's no real way to tell unless you either a) add enough data for short-term variation to cancel out or b) use statistical techniques to factor out the known natural variation. In this article, I expand on my previous analyses of surface temperature, ...

Meta-analysis

Image
A meta-analysis is a technique that combines data from multiple sources into one large dataset for statistical analysis.  This overcomes one of the main problems with many studies, which is sample size.  It's difficult and expensive in many fields to get a sufficiently large sample.  Doing a meta-analysis on data from multiple studies is a powerful way to get around that limitation.

One of the first questions...

Image
First, an introduction.  This blog will cover topics in ecology and environmental science.  That is, after all, my background.  I hold Bachelor's and Master's degrees in Biology, with emphasis on ecology, and am completing a Ph.D. in Environmental Science.  My research focus covers forest ecology but my training runs the gamut from calculating the spread and fate of pollutants in groundwater to creating watershed models to population ecology to ecosystem cycles.  My teaching experience is on the college level, having taught courses ranging from general biology to physiology to ecology, environmental science, and evolution. One of the first questions I'm usually asked when people find out my background is "Is global warming real?"  My answer is "Yes, it's real–and it's caused by humans."  In this post, I'll explore the data that shows that the Earth is warming.  I'll get into the data why we're the cause in subsequent posts.