R code for Shifting Bell Curves
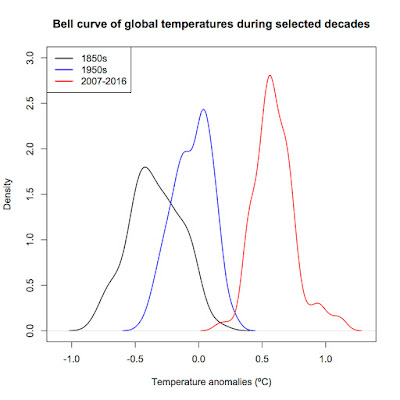
A commentator named Jonathan asked for the code by which I produced my bell curve graph way back in 2013. Here it is. Note : I'm using the Cowtan and Way 2.0 temperature reconstruction in this example rather than NASA GISS as in the original post as the Cowtan and Way data is more accessible for use in R. >Cowtan<-read.table("http://www-users.york.ac.uk/~kdc3/papers/coverage2013/had4_krig_v2_0_0.txt", header=F) > names(Cowtan)<-c("Year", "Temperature", "Uncertainty1", "Uncertainty2", "Uncertainty3") #Name the columns > summary(Cowtan) #Check to see if the column names look right and the data imported correctly > S1850s<-subset(Cowtan, Year<1860) #Get subsets of each decade > S1950s<-subset(Cowtan, Year>=1950 & Year<1960) > S2007<-subset(Cowtan, Year>=2007 & Year<2017) > D1850s=density(S1850s$Temperature) #Get the density kernals > D1950s<-density(S1...
