Posts

Showing posts with the label no warming since 1998

Global warming, The Wall Street Journal, and John Gordon

Image
John Steele Gordon published a commentary in The Wall Street Journal on July 30 that, on its face, sounds reasonable.  Gordon makes the case that we should be cautious about calling climate science settled as science is always changing.  No real quibbles there, as science has shown that nothing is ever truly "settled" science.  Unfortunately, that's as close to reality as Gordon comes.  The rest of the commentary simply shows off Gordon's simplistic view of history, science, and, especially, the current state of climate science.

What is the deal with RSS?

Image
It's nice when a topic for a new post lands in your lap.  Or, in this case, in the comments of one of your old posts.  An anonymous commentator made several statements concerning RSS that warrant a longer explanation than is possible in a reply on the comment section.  This is going to be a long, stats-heavy post.  You've been warned.

Where 2014 would rank if global temperature reverted to the 1979-2013 trend

Image
Given that 2014 is nearly over (~3 weeks to go), we're going to be hearing even more about the possibility that 2014 will be the warmest year in the instrumental record.  I myself made the pile higher and deeper with my last post .  That raised a question in my mind: Where should global temperature be in 2014 according to the warming trend since 1979 (the first full year of the satellite record)?

Tom Luongo's multiple lies about climate change

Image
An old friend posted an " article " by Tom Luongo, a former chemist (B.S. from the University of Florida) who now writes the Resolute Wealth Newsletter, on Facebook.  Unfortunately, that article is chock full of lies about climate science.  Since Facebook comments aren't the best forum for debunking Gish Gallops, I'm taking the liberty of debunking them here. [Update: Since Luongo got most of his claims from John Casey, I've written something about his brand of science here .]

Ignorance, blindness, and outright misinformation

Image
A childhood acquaintance on Facebook posted a link to a CBN News article that serves as a good example of what is wrong with conservative news media.  Written by Dale Hurd, it is a mash-up of science denier canards with little in the way of actual science or evidence. The first paragraph sets the tone, making fun of the scientists who were trapped in Antarctic ice.  Nowhere does Hurd mention HOW the scientists were trapped: A storm packed sea ice into the bay their ship was in.  Now this can happen at any time of the year but it doesn't mean that the ice is growing.  It's summer down in Antarctica, a time when Antarctic sea ice melts from ~19 million km 2 in September down to ~2-3 million km 2 by March.  That leaves plenty of broken pack ice for winds to blow around, especially in the early part of the melt season such as December when the ship was trapped.  So the irony is that those scientists were trapped by MELTING sea ice, an irony completely los...

IPCC models versus actual temperatures

Image
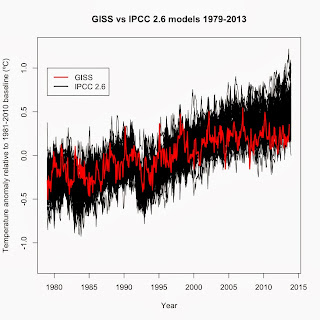
One of the dominant memes among climate deniers are that climate models are inaccurate.  While true, particularly since 1998 (see Fyfe et al. 2013 ), that fact doesn't mean that global warming isn't happening or that global warming is due to a natural cycle and not CO 2 as many deniers claim.  For those leaps of logic to be true, the entire field of radiative physics, 152 years of experiments, and 40+ years of satellite observations would all have to be wrong.  Nor does it mean that climate isn't as sensitive to changes in radiative forcing as multiple studies have shown it to be (i.e. Paleosens 2013 ).  What it means is far more complex. To illustrate this complexity, I compared IPCC AR5 climate models with surface temperatures (GISS).  The AR5 models were run with four scenarios, labeled RCP 2.6, RCP 4.5, RCP 6.0, and RCP 8.5.  Data for each scenario, along with global temperature data, AMO, PDO, etc. are available at Climate Explorer .  The RCP s...

How to spot outliers in regression analysis

Image
Much of the debate over the possible pause in surface temperatures since 1998 really hinges on 1998 being an outlier.  And not only an outlier but an influential data point, which means that its very presence changes the overall regression trend.  In this post, I'll show how to identify outliers, high-leverage data points, and influential data points. First, some basic definitions.  An outlier is any data point that falls outside the normal range for that data set, usually set as being 2 standard deviations from the average.  In regression analyses, an outlier is any data point where its residual falls outside the normal range.  High leverage data points are made at extreme values for the independent variables such that there are few other data points around, regardless of whether or not those data points change the overall trend.  An influential data point is an extreme outlier with high leverage that alters the overall trend. Now for the analysis, sta...

Yet another nail in the coffin for the "No warming since 1998" claim

Image
As I've already covered in the past ( here , here , and here ), the claim that the Earth hasn't warmed since 1998 is pure bunk.  Today, I re-ran a linear regression analysis and discovered that UAH satellite temperature data now shows statistically significant warming since 1998:

Meta-analysis

Image
A meta-analysis is a technique that combines data from multiple sources into one large dataset for statistical analysis.  This overcomes one of the main problems with many studies, which is sample size.  It's difficult and expensive in many fields to get a sufficiently large sample.  Doing a meta-analysis on data from multiple studies is a powerful way to get around that limitation.

One of the most common refrains...

Image
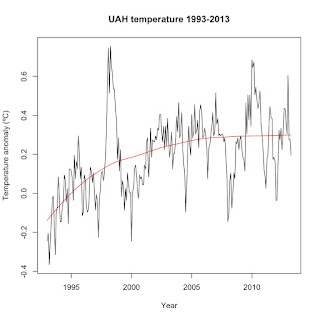
from climate skeptics is that the Earth hasn't warmed since 1998.  Why 1998?  Because that is the only start point that allows them to make that claim.  First, here's a graph of UAH since 1993, plotted to the 1981-2010 baseline and with a loess regression trend to highlight the trend: