Posts

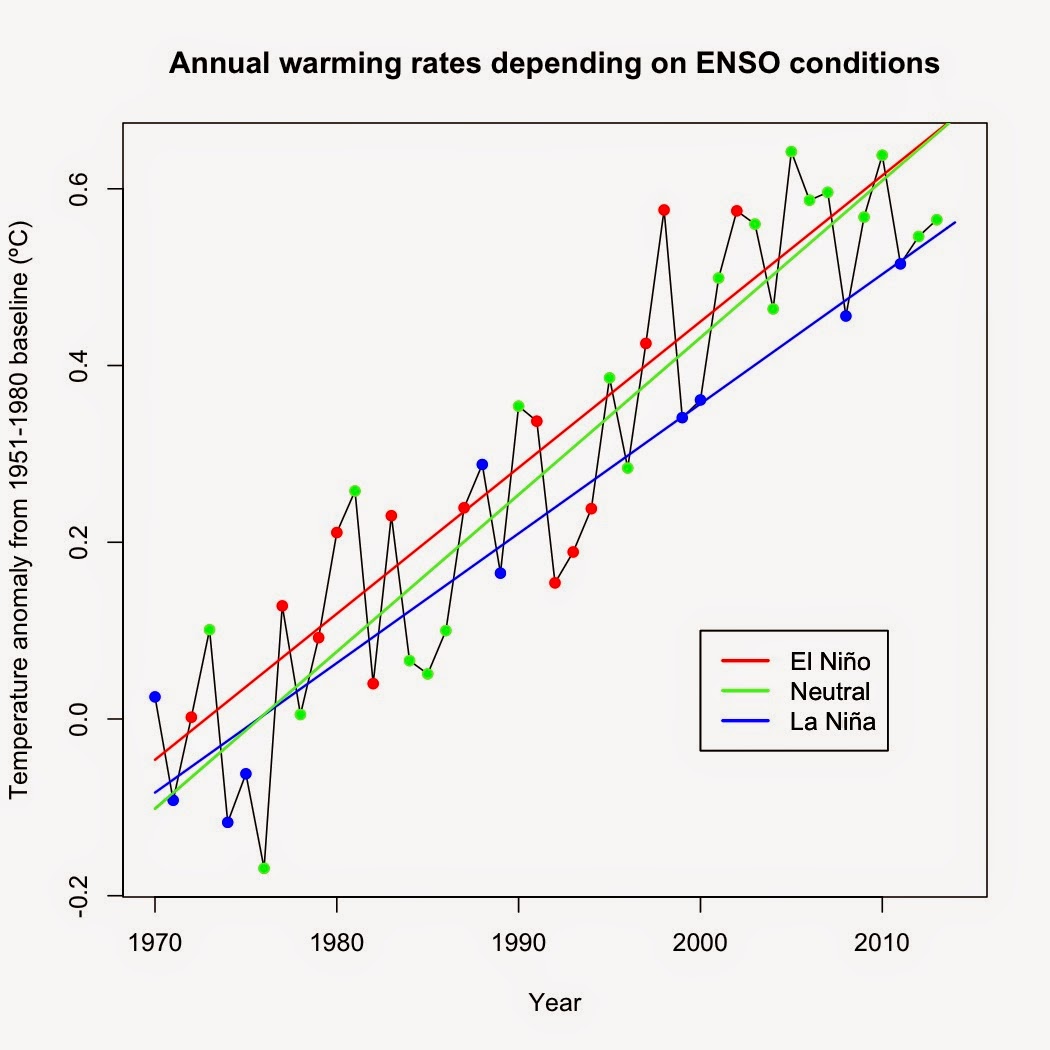
A prediction of global surface temperatures if an El Niño forms this year.
Image
There are increasing evidence that we'll have our first El Niño since 2010 sometime within the next year.  Just for fun, I thought it would be interesting to try to predict what the annual global average temperature would be if an El Niño developed as expected. I took Berkeley Earth land + ocean annual temperature data starting in 1970 and categorized each year as El Niño, La Niña, or neutral using average MEI data for each year.  Any year with an MEI average  ≥ +0.5 was classed as an El Niño year.  La Niña years had MEI values ≤ -0.5, whereas neutral years were between -0.5 and +0.5.  I then performed a separate linear regression on each category.

The danger of anecdotal evidence

Anecdotal evidence is one of the most common forms of evidence.  We encounter it frequently in life, from those stories about the relative who tried some new cure to reports of children developing autism after receiving vaccines to stories on Fox News about how some snowstorm somehow disproves global warming.  However common, anecdotal evidence is the worst and most misleading form of evidence.

Another denier trying to baffle with BS

Image
On Huffington Post, I was challenged by a denier going by the screen name "Shuman the Human".  You can read the exchange here .  It's incomplete as for some reason my attempts to reply to his comment keep getting zapped.  Update: Looks like HuffPost zapped his last comment as well.

Yet another invasive insect.

Image
I've written before about the impact of the Emerald Ash Borer on forests in southwestern Ohio.  My introduction to the pest I'm profiling this time came last summer when I found my tomato, pumpkin, cucumber, acorn squash, watermelon, and summer squash vines infested with a strange brown bug with an oddly shaped abdomen: Halyomorpha halys (Stål), the brown mamorated stink bug. Picture from http://www.stopbmsb.org/stopBMSB/assets/Image/BMSB-on-bark-istock350w.png

New Berkeley Earth temperature dataset vs existing datasets

Image
The Berkeley Earth team released a new temperature analysis that includes both land and ocean surface temperatures .  They used their existing land data and merged it with HadSST data (note: not HadSST3 as I originally wrote), using kriging to interpolate temperatures where data did not directly exist.  In this, their methodology is similar to the recent Cowtan and Way ( 2013 ) paper, however, Cowtan and Way used HadSST3 for their ocean data.  I've compared their new results over the past 30 years (Jan 1984-Dec 2013) to GISS, HadCRUT4, NCDC, UAH, and Cowtan and Way's results, first standardizing all temperature anomalies to the 1981-2010 baseline.  Why the past 30 years?  Thirty years is generally considered the standard time period for measuring climate.  All trends mentioned in this article are calculated using linear regression corrected for autocorrelation.

Monckton, RSS, and no warming since September 1996

Image
While browsing a climate change article on Huffington Post, I noticed a global warming denier using a Watts Up With That post by Lord Monckton as "evidence" that global temperatures haven't changed since September 1996.  In it, Monckton uses least squares regression to show that satellite data from RSS is flat (trend: -0.0001394ºC per year) between September 1996 and January 2014.

Charles Krauthammer and settled science

Image
An op-ed in my local paper caught my eye yesterday.  By Charles Krauthammer, it's largely a fact-free repetition of talking points trying to dispute whether or not climate change is settled science.  While my hometown paper has the editorial paywalled, it's available at the Washington Post .  Some of his points are utterly unrelated, some are badly outdated, and some are out-right lies.