Posts

Showing posts from May, 2015

Doom and gloom or realism?

Image
Humanity is in trouble with climate change.  A recent article in Vox by David Roberts came to that conclusion.  It begins with "There has always been an odd tenor to discussions among climate scientists, policy wonks, and politicians, a passive-aggressive quality, and I think it can be traced to the fact that everyone involved has to dance around the obvious truth, at risk of losing their status and influence. The obvious truth about  global warming is this: barring miracles, humanity is in for some awful shit."  The basis for that conclusion?  Total carbon emissions to date, which are closely following the RCP 8.5 curve from the IPCC. That black curve is emissions to date.  We as a civilization are on track to take carbon dioxide levels to around 1000 ppm by 2100 AD.  The 12-month moving average of atmospheric CO 2 levels shows that we're already at 398.83 and still accelerating upward. That locks us into at least 1.53ºC of total...
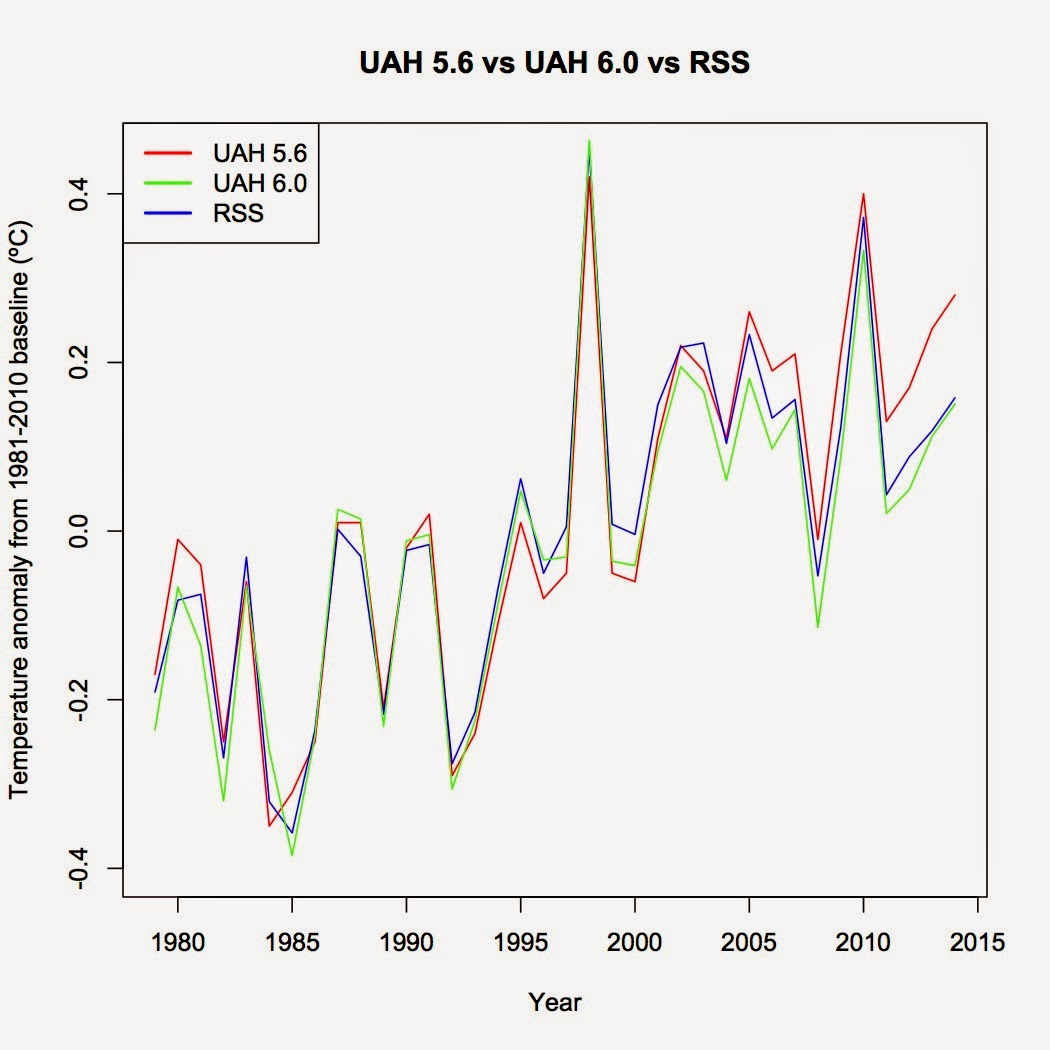
First look: UAH 6.0 vs UAH 5.6 vs RSS

Image
Spencer and Christy recently released a new version (version 6.0) of the UAH satellite temperature data . To see how their data has changed, I've compared the 6.0 version to the earlier 5.6 version and compared both to RSS, similar to what I did before . All calculations were made using annual data. The difference between UAH 5.6 and UAH 6.0 is quite dramatic, especially since 2000, and the difference has grown over time. Difference calculated by subtracting annual version 6.0 values from the respective 5.6 values.   Comparing both UAH versions to RSS shows that while version 5.6 was consistently warmer than RSS since 2003, version 6.0 has a tendency to run cooler than RSS since 1998. The effect all the changes from 5.6 to 6.0 had on the calculated trend was drastic. Since 1990, the average version 6.0 trend is 0.0094ºC/year lower than the same trend in version 5.6.  For version 5.6, only the trends since 1997, 1998, and 2000 were not statistically significa...