Hottest first six months on record
I know, I know, I'm behind a bit. Most of the stories on the first six months of this year came nearly a month ago. Better late than never. By now, we all know that the world is headed toward its hottest year ever, breaking the record set just last year. In this post, I'm going to analyze just how abnormal normal the first half of the year has been.
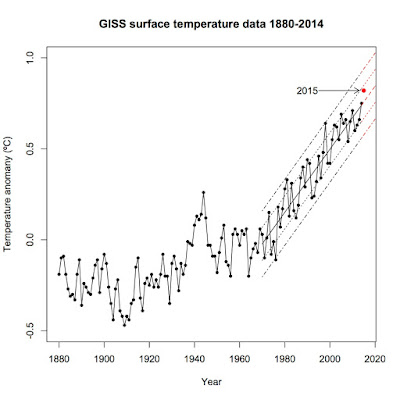
Here is a plot of annual temperatures since 1880:
I've added the 1970-2014 linear trend and then extrapolated that trend out to 2020. I then calculated the standard deviation of the residuals from that trend. The lines on either side of that trend are 1 and 2 standard deviations away from the trend. One standard deviation came in at 0.0907ºC. As warm as 2015 has been so far, the average global temperature of the first six months (0.82ºC) isn't even 1 standard deviation away from the predicted temperature for the entire year based on the trend (predicted temperature: 0.76ºC). The probability that we would see a 0.06ºC difference from the predicted temperature? 74.6%. While this year has been quite warm to date, it is not exceptionally warm given the overall warming trend since 1970 (+0.173ºC/decade).
What would an exceptionally warm 2015 look like? That depends on your definition of "exceptional." I defined it as close to 2 standard deviations from the trend, which came to a global average of 0.94ºC or greater. The only years that have even come near that standard since 1970 are 1983 and 1998, both years which saw monster El Niño events. Should the current El Niño approach the magnitude of either of those events, I would not rule out either 2015 or 2016 challenging the 2 standard deviation line. So while 2015 already looks to shatter 2014's record hot global temperature, it could get even hotter. Stay tuned.


Could El Nino have something to do with the temperature rise?
ReplyDeleteNot really. ENSO makes yearly temperatures fluctuate around the overall trend but little else, as I showed here: http://environmentalforest.blogspot.com/2014/10/trend-versus-cycles-in-global.html
Deletekul post
ReplyDelete