Posts

Showing posts with the label Global warming

What are the odds that 2015 will not be the hottest year on record?

Image
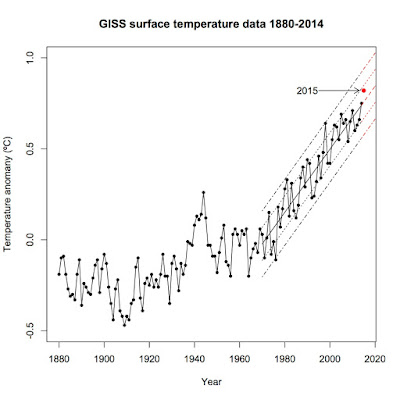
Let me be upfront with you: I think it's a foregone conclusion that 2015 will beat out 2014 as the hottest year on record. However, I decided to test that idea, just to be certain. The way I did it was simple: I first calculated the year-to-date average (January - July) and then calculated what the August — December average would have to be to keep the 2015 average temperature at or below that of 2014. I then calculated the August — December average for each year since 1970, fitted a trend, and calculated the standard deviation of the residuals. Last, I calculated the expected August - December average for 2015 given the trend and the difference between the expected August - December average and what that average would have to be to keep 2015 from setting a new record.  I then used z-scores to calculate the probability that the remainder of 2015 would fall to that level or below. Annual global temperature according to NASA GISS since 1970 Year to date, 2015 sits at +0.82...

Global warming, The Wall Street Journal, and John Gordon

Image
John Steele Gordon published a commentary in The Wall Street Journal on July 30 that, on its face, sounds reasonable.  Gordon makes the case that we should be cautious about calling climate science settled as science is always changing.  No real quibbles there, as science has shown that nothing is ever truly "settled" science.  Unfortunately, that's as close to reality as Gordon comes.  The rest of the commentary simply shows off Gordon's simplistic view of history, science, and, especially, the current state of climate science.

Hottest first six months on record

Image
I know, I know, I'm behind a bit.  Most of the stories on the first six months of this year came nearly a month ago.  Better late than never.  By now, we all know that the world is headed toward its hottest year ever, breaking the record set just last year.  In this post, I'm going to analyze just how abnormal normal the first half of the year has been.

US versus global temperatures

Image
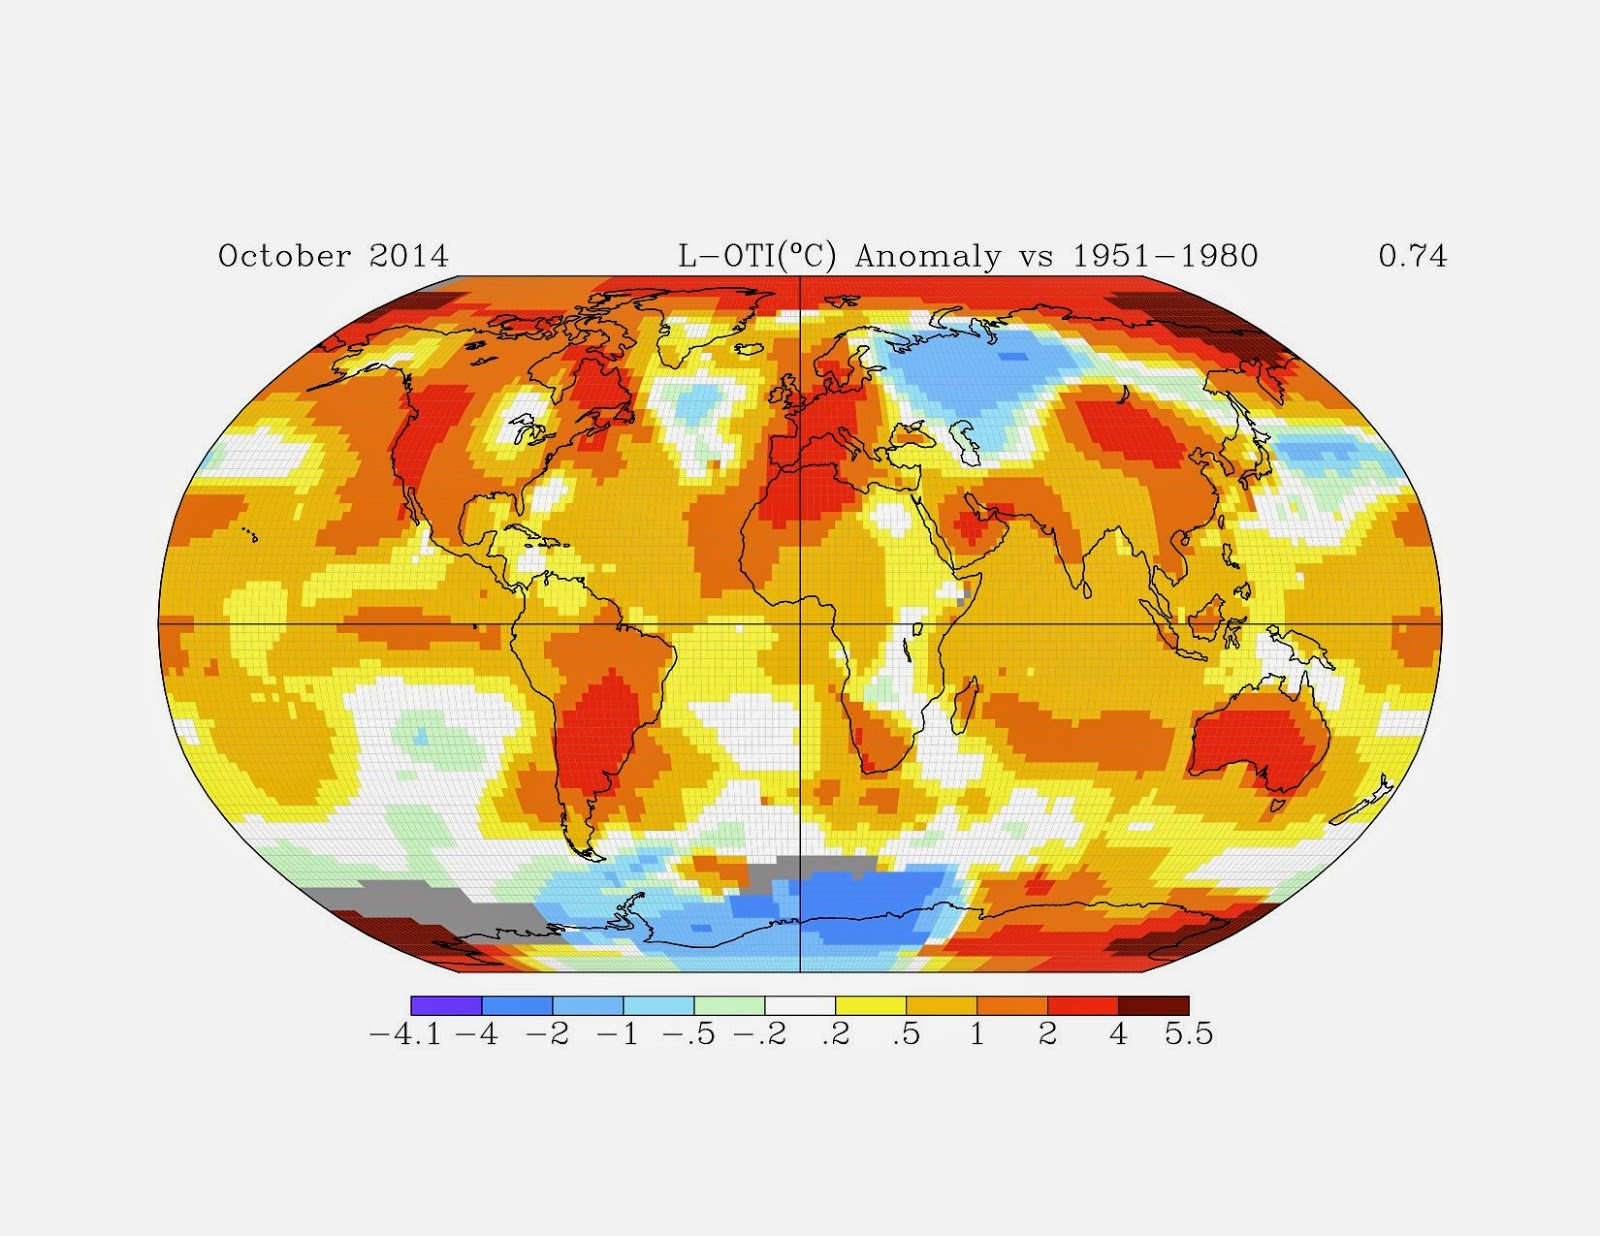
One of the talking points I see (and hear) time and again here is the question "If the world's getting hotter, why is it cold here?", "here" usually referring to the eastern United States.  Another variation goes "Global warming can't be happening because US temperatures haven't risen in _____ years."  Yes, it's the good old "It's cold in my backyard so the planet can't be warming up" argument. Here's why it's dead wrong.

The "hiatus" doesn't exist.

Image
That is the conclusion of a new study published in Science yesterday.  Tom Karl and his co-authors used a newly available database of weather station data that combined the Global Historical Climatology Network (GHCN) used by NOAA and NASA with over 40 other historical data sources, effectively doubling the size of the available land temperature data set.  They applied the same corrections for changes in location, urban heat island effect, etc as with the GHCN-only data set and used the same algorithms to calculate the global average over land.  To get a global average, they used the Extended Reconstructed Sea Surface Temperature dataset version 4 (ERSST4), which better integrates ship-based temperature data and buoy-based temperature data, and merged it with their new land data.  Karl et al. then created a third global temperature average that also fills in the gaps between weather stations in the polar regions. Their new data set shows much higher trends than th...

Doom and gloom or realism?

Image
Humanity is in trouble with climate change.  A recent article in Vox by David Roberts came to that conclusion.  It begins with "There has always been an odd tenor to discussions among climate scientists, policy wonks, and politicians, a passive-aggressive quality, and I think it can be traced to the fact that everyone involved has to dance around the obvious truth, at risk of losing their status and influence. The obvious truth about  global warming is this: barring miracles, humanity is in for some awful shit."  The basis for that conclusion?  Total carbon emissions to date, which are closely following the RCP 8.5 curve from the IPCC. That black curve is emissions to date.  We as a civilization are on track to take carbon dioxide levels to around 1000 ppm by 2100 AD.  The 12-month moving average of atmospheric CO 2 levels shows that we're already at 398.83 and still accelerating upward. That locks us into at least 1.53ºC of total...

The view from Greenland's highest peak

Image
It's amusing to me whenever a science denier cites the ice cores in Greenland as "proof" that global warming either a) isn't happening or b) isn't a big deal. It's a horrible argument for deniers to make. Here's why. First, we're talking about ice cores taken from one location in Greenland. Not only is it one single location, but it just happens to be Greenland's highest point (10,660 feet/3,249 meters above sea level) and near the center of the continental glacier that covers Greenland. Guess what? It's going to be cold up there, just from the elevation alone, to say nothing of how all that ice affects the local temperature. Location matters. It's amusing that the same deniers who claim urban heat island when trying to explain away any warming trends seem to forget that when faced with factors that would decrease the rate of local temperature change. Second, when we talk about global warming, we mean the entire planet, which is fa...

Using NOAA's Climate-at-a-glance widget to fact-check James Taylor

Image
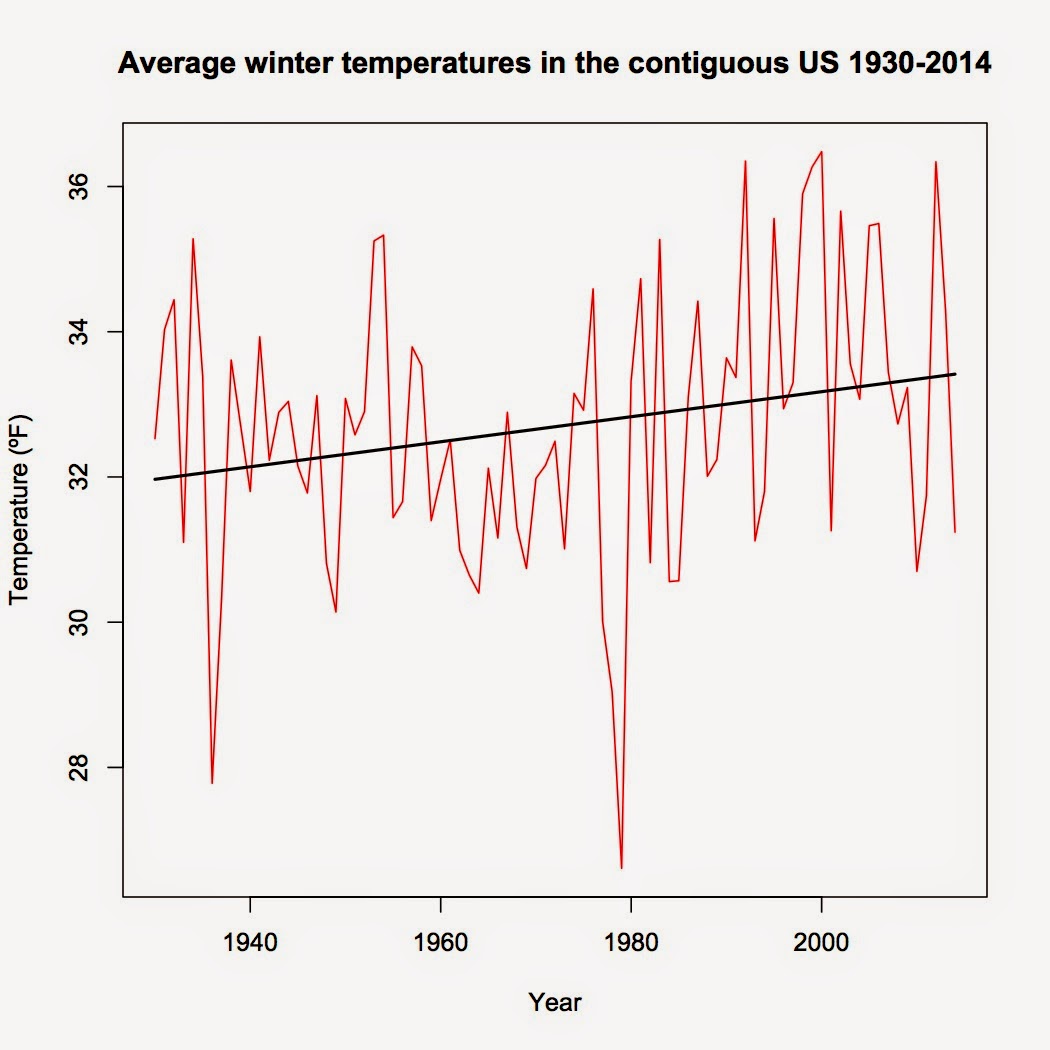
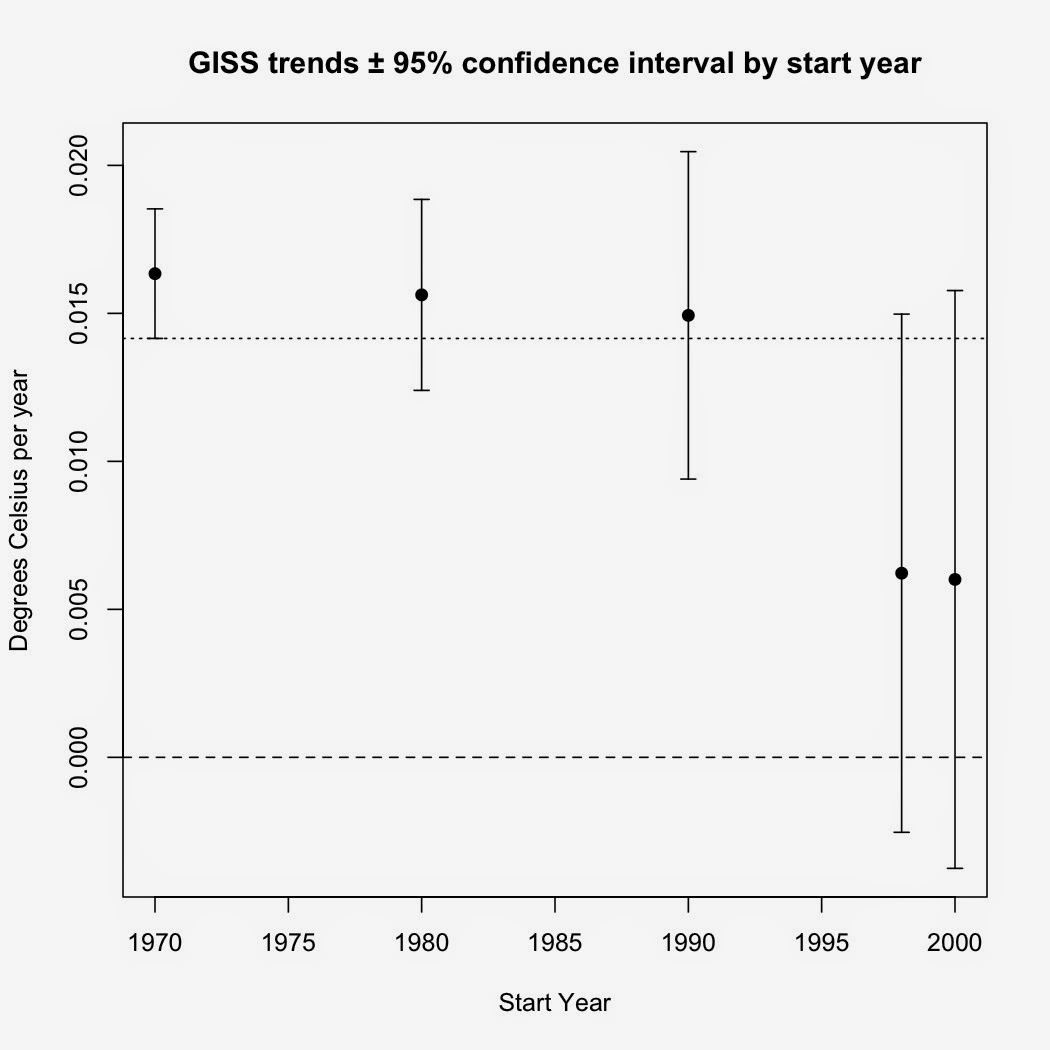
Okay, I'm back.  Sorry for the lengthy gap between posts but work and losing my laptop intervened.  Now to get back in the saddle. A reader by the pen name of cosmicomic asked several questions on my last post concerning James Taylor's claims about winter-time cooling in the US.  Since NOAA's climate-at-a-glance widget didn't work properly for him, I thought I'd post a video of what one should see as well as expound on the bogus method Taylor used.  Specifically, I'll examine Taylor claim that winters in the US have cooled, with the cooling trend dating back to 1930. First, a very brief tutorial by yours truly on using NOAA's widget and what you should see when you do: Now, Taylor's claim that US winters have cooled since 1930 is already in trouble. The simple linear regression model done by the widget shows that US winters have warmed by an average of +0.18ºF/decade since 1930. ARMA time series regression shows that the warming trend since 193...

James Taylor has no idea what he's talking about

Image
A couple days ago, James Taylor of the Heartland Institute published what is one of the most disingenuous, misleading, and ignorant articles I have ever had the misfortune of reading.  It's a wonder Forbes even saw fit to publish such obvious claptrap.

2014 among the hottest years on record.

Image
This is an update to my previous post on this topic, which was based largely on January-November data.  The full-year data is rolling out and no matter who is measuring, 2014 was a hot year for the Earth.

No, a cold snap in the US does NOT mean that global warming has stopped.

Image
This feels like I'm in the movie Groundhog Day .  If there's a cold snap in the US, there's some science denier citing it as "proof" that there's no global warming.  This argument fails for multiple reasons.

The non-existant pause in global temperatures

Image
Regular readers of this blog will know that I am skeptical of claims that global warming in atmospheric temperatures have paused since 1998, having written several posts questioning the existence of such a pause.  In this edition, I'll run down the main evidence that, in my opinion, show that the pause is a figment of the denialsphere's imagination.

Where 2014 would rank if global temperature reverted to the 1979-2013 trend

Image
Given that 2014 is nearly over (~3 weeks to go), we're going to be hearing even more about the possibility that 2014 will be the warmest year in the instrumental record.  I myself made the pile higher and deeper with my last post .  That raised a question in my mind: Where should global temperature be in 2014 according to the warming trend since 1979 (the first full year of the satellite record)?

Hottest years-to-date on record

Image
Back in August, I wrote a post that found the January-June period was the third hottest on record ( based on the Cowtan-Way data set which corrects the coverage bias in HadCRUT4 data).  This post will revise and update that earlier article, incorporating GISS, UAH, NCDC, HadCRUT4, and Cowtan-Way data sets.  I am not including RSS, as that data set has shown false cooling since 2000.

Tom Luongo's multiple lies about climate change

Image
An old friend posted an " article " by Tom Luongo, a former chemist (B.S. from the University of Florida) who now writes the Resolute Wealth Newsletter, on Facebook.  Unfortunately, that article is chock full of lies about climate science.  Since Facebook comments aren't the best forum for debunking Gish Gallops, I'm taking the liberty of debunking them here. [Update: Since Luongo got most of his claims from John Casey, I've written something about his brand of science here .]

Temperature trends and natural variation in the Pacific Northwest

Image
A recent study by Johnstone and Mantua ( 2014 ) found a high correlation (r = 0.78) between sea surface temperatures since 1900 and changes in atmospheric pressure over the Northeastern Pacific, claiming that 80% of the variance in sea surface temperatures in the Northeastern Pacific was explained by changes in the North Pacific high.

James Taylor versus relative humidity and specific humidity

Image
It appears that the relative humidity and specific humidity continues to trip some people up.  Yes, I'm thinking of the screed James Taylor wrote on Forbes.com on Aug. 20 .  In his article, Taylor trumpets two "facts".  First, that relative humidity has declined and second, that specific humidity isn't rising as fast as global climate models predict.  Since climate models assume that relative humidity has stayed constant, Taylor then claims that models are overestimating global warming.  Unfortunately for Taylor, his "facts" don't check out.

R code for my Seasonal Trends graph

Image
I had a request for the code I used to generate the graphs in my Seasonal Trends post. While it looks complex, the R code for it is very simple IF you have the data ready.    I'm assuming that you already have the temperature dataset you want as an R object (I have several datasets in an object I simply call "monthly": GISS, Berkeley Earth, Cowtan-Way, HadCRUT4, UAH, and RSS, along with the year/decimal month Time, Year, and numeric Month).  The code I used to generate the graph is as follows: #Create separate datasets for each season monthly.79<-subset(monthly, Time>=1978.92 & Time<2013.91) DJF<-subset(monthly.79, Month=="12" | Month =="1" | Month=="2") DJF$Year_2 <- numeric (length (DJF$Year)) for (i in 1:length (DJF$Year) ) {         if ( DJF$Month [i] == 12) {                 DJF$Year_2[i] <-   DJF$Year [i] + 1         }     ...

Risbey et al. 2014

Image
It seems the canard about how IPCC models are inaccurate just won't go away.  I've covered it before on this blog .  The newest incarnation of that canard revolves around a new paper by Risbey et al. ( 2014 ).  It seems that many just don't understand what Risbey et al. did and they definitely don't understand the results of that paper.

What will summers be in AD 2100?

While I'm working on a longer post, here is an interesting interactive graphic from Climate Central .  Just type in the city you are interested in and see what the summers will be for that city in AD 2100. It shows which US city (or world city) currently experiences average summer temperatures as hot as those predicted for selected US cities and gives you an idea of how far north the climate bands will have shifted over the next 86 years. Average summer highs in my current hometown are predicted to warm up by nearly 6.5ºC from the current average high of 29.4ºC to a predicted average high of 35.9ºC.  How much will your closest city warm?