Posts

Tom Luongo's multiple lies about climate change

Image
An old friend posted an " article " by Tom Luongo, a former chemist (B.S. from the University of Florida) who now writes the Resolute Wealth Newsletter, on Facebook.  Unfortunately, that article is chock full of lies about climate science.  Since Facebook comments aren't the best forum for debunking Gish Gallops, I'm taking the liberty of debunking them here. [Update: Since Luongo got most of his claims from John Casey, I've written something about his brand of science here .]

Musings after the US election

For anyone paying attention, the US election yesterday was a disaster for Democrats.  That party lost control of the US Senate (likely 53-47) and took a drubbing in US House races (242-174) and US governors' (24-8) races.  The end result as far as science, environmental policy, and climate change is that science deniers now control key oversight committees on science, as many news organizations have noted.  The likely result for at least the next two years is unending investigations, waste-of-time hearings, and other obstacles erected to make environmental regulators' working lives a living hell.  Forget about the US ratifying any environmental treaties, much less anything having to do with climate change.  On the state level, I expect rollbacks of renewable energy mandates at the least, along with attempts to repeal other environmental regulations and meaningless resolutions attempting to nullify various federal laws and/or appropriate federal lands for state a...

Trend versus cycles in global temperature data

Image
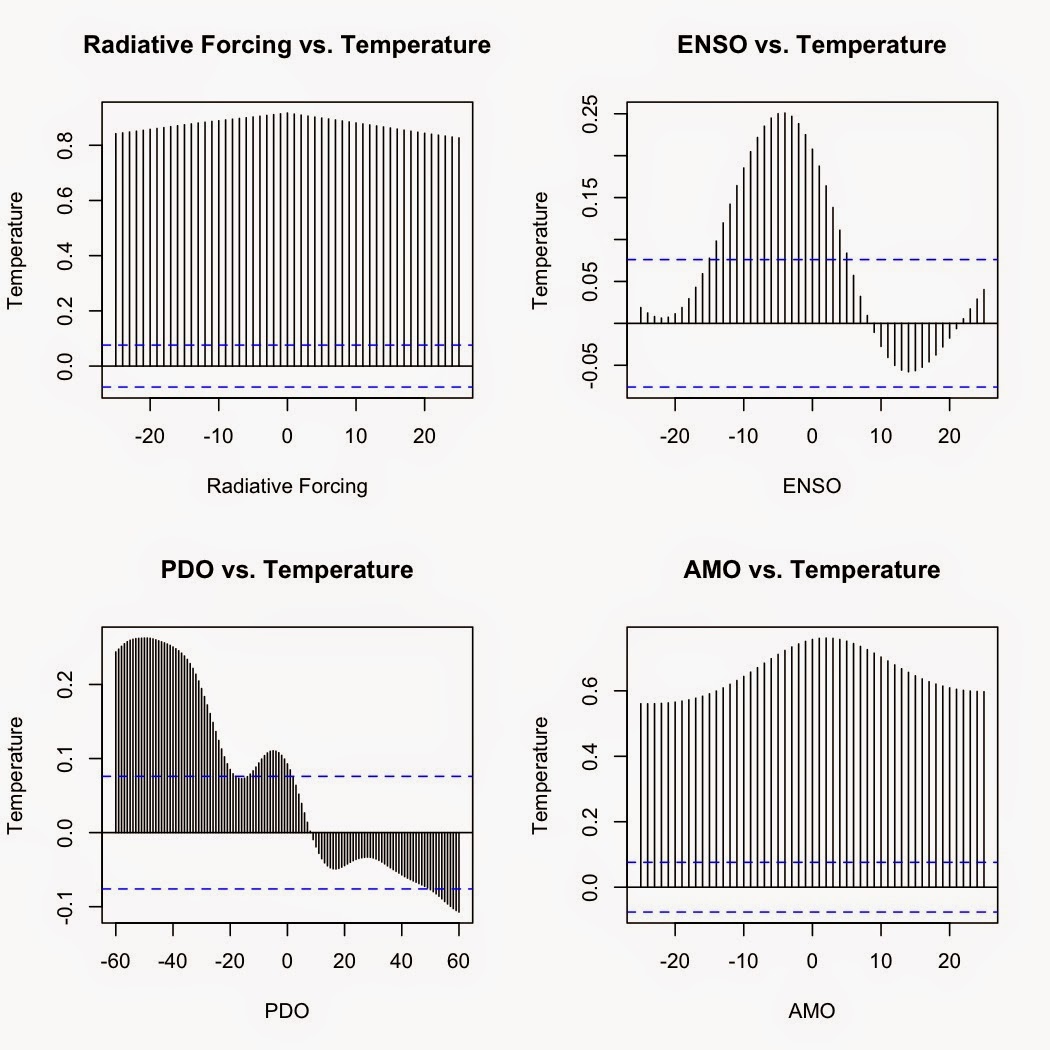
One of the most useful features about models, both statistical and physical, is that you can examine different aspects of the system you are analyzing separate from all other other influences.  Want to see if El Niño/Southern Oscillation could be driving the trend in global temperatures?  Construct a realistic model, then isolate the ENSO term.  Want to see if a combination of natural cycles explains the trend?  Isolate the terms for the natural cycles from those for greenhouse gases, and examine the results.

Global warming: Carbon dioxide vs. Natural cycles

Image
The recent paper by Johnstone and Mantua ( 2014 ) has certainly made the rounds in conservative circles.  It's popped up several times on my Facebook feed as various friends and acquaintances share articles about it.  Unfortunately, most of those articles get it wrong, usually twisting Johnstone and Mantua's findings to imply that 80% of ALL global warming is natural.  As I explained in my last post , that is a blatant misinterpretation of their paper, which only applies to the northeastern Pacific and coastal regions of the US Pacific Northwest.  Globally, natural cycles do not explain the trend in global temperatures.  How can I say that?  Do the statistics.

Temperature trends and natural variation in the Pacific Northwest

Image
A recent study by Johnstone and Mantua ( 2014 ) found a high correlation (r = 0.78) between sea surface temperatures since 1900 and changes in atmospheric pressure over the Northeastern Pacific, claiming that 80% of the variance in sea surface temperatures in the Northeastern Pacific was explained by changes in the North Pacific high.

Seeing how well predictions for September Arctic sea ice did in 2014

Image
In August, I published a post listing predictions of what the average September sea ice extent would be in 2014 .  Since September 2014 is now past, we can go back and see how those predictions panned out.  First, here are the predictions again: Month Model R 2 Ice extent in 2014 (millions of km 2 ) Predicted Sept. ice extent (millions of km 2 ) Graph June -13.5300 + 1.6913x 0.7522 11.09 5.23 July -4.80933 + 1.18618x 0.8796 8.17 4.88 August -1.69389 + 1.12965x 0.9674 6.13 5.23

Trend since 1998—significant??

Image
I had a question sent to me about the trend since 1998.  As many of you know, my last post included an analysis which showed that the linear regression trend since 1998 was statistically significant. Trends versus start year.  Error bars are the 95% confidence intervals. My questioner asked if I had accounted for autocorrelation in my analysis.  The short answer is "No, I did not."  The reason?  According to my analysis, it wasn't necessary. Here are my methods and R code. #Get coverage-corrected HadCRUT4 data and rename the first two columns CW<-read.table("http://www-users.york.ac.uk/~kdc3/papers/coverage2013/had4_krig_annual_v2_0_0.txt", header=F) names(CW)[1]<-"Year" names(CW)[2]<-"Temp" #Analysis for autocorrelation—I check manually as well but so far the auto.arima function has performed admirably. library(forecast) auto.arima(resid(lm(Temp~Year, data=CW, subset=Year>=1998)), ic=c("bic")) The su...